The NVDA Direction Philosophy: Positive Expectancy Wins Over High Win Rates
Contact customer support at support@nvdadirection.com
Overview
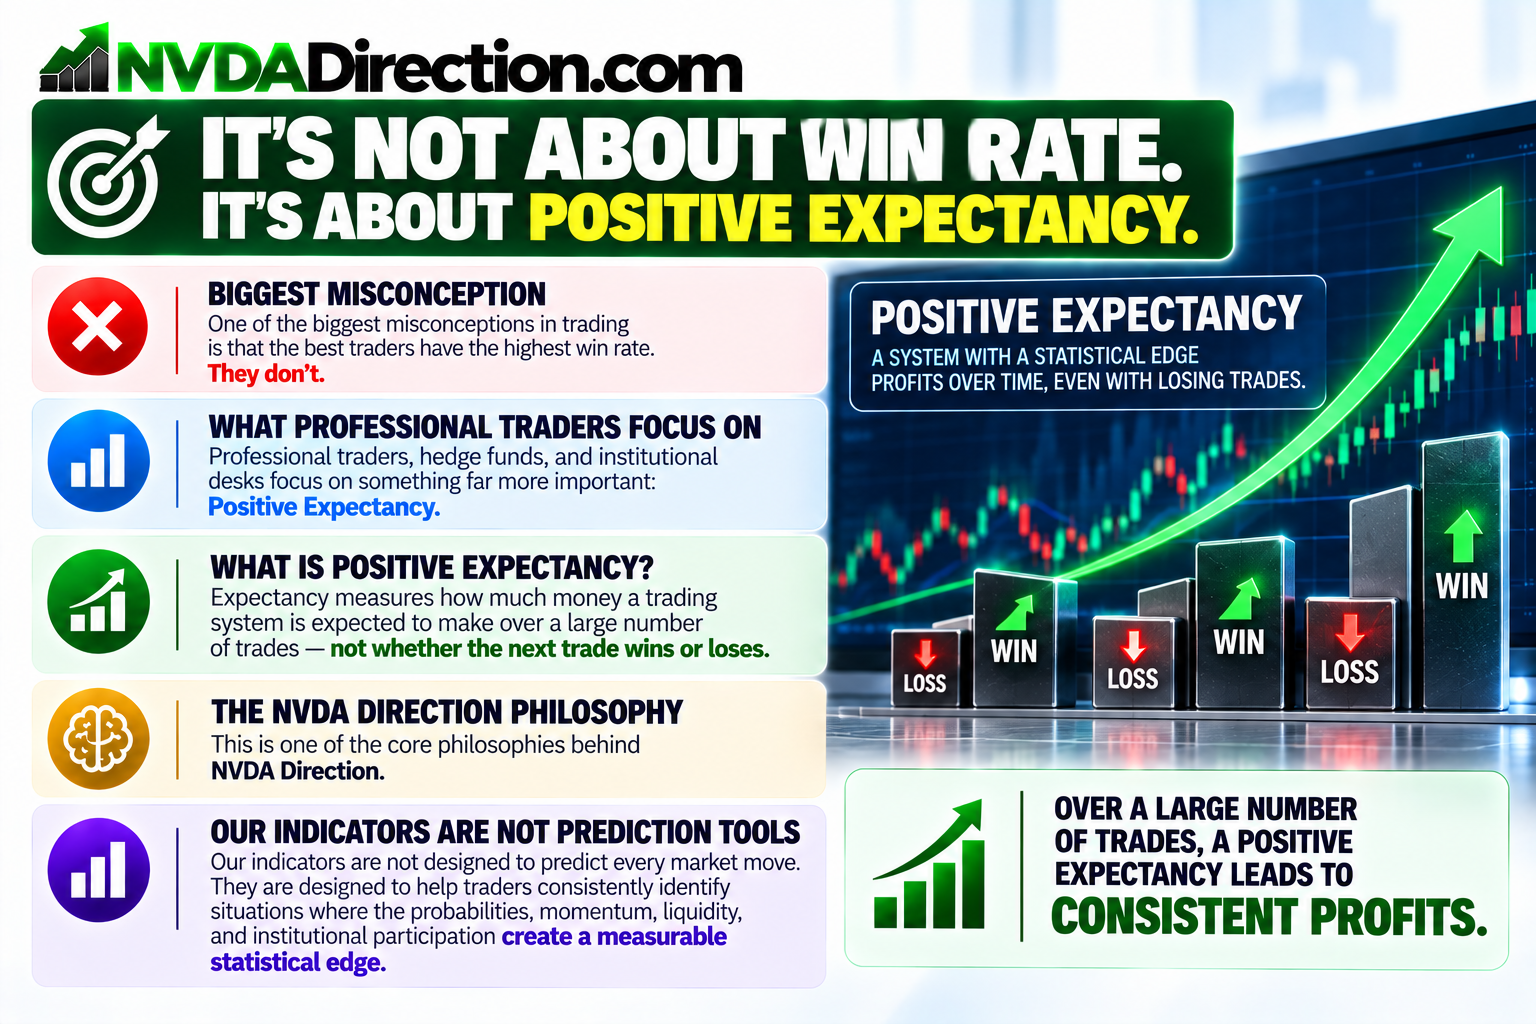
One of the biggest misconceptions in trading is that the best traders have the highest win rate.
They don't.
Professional traders, hedge funds, and institutional desks focus on something far more important:
Positive Expectancy
Expectancy measures how much money a trading system is expected to make over a large number of trades—not whether the next trade wins or loses.
This is one of the core philosophies behind NVDA Direction.
Our indicators are not designed to predict every market move.
They are designed to help traders consistently identify situations where the probabilities, momentum, liquidity, and institutional participation create a measurable statistical edge.
The Goal Isn't More Winners
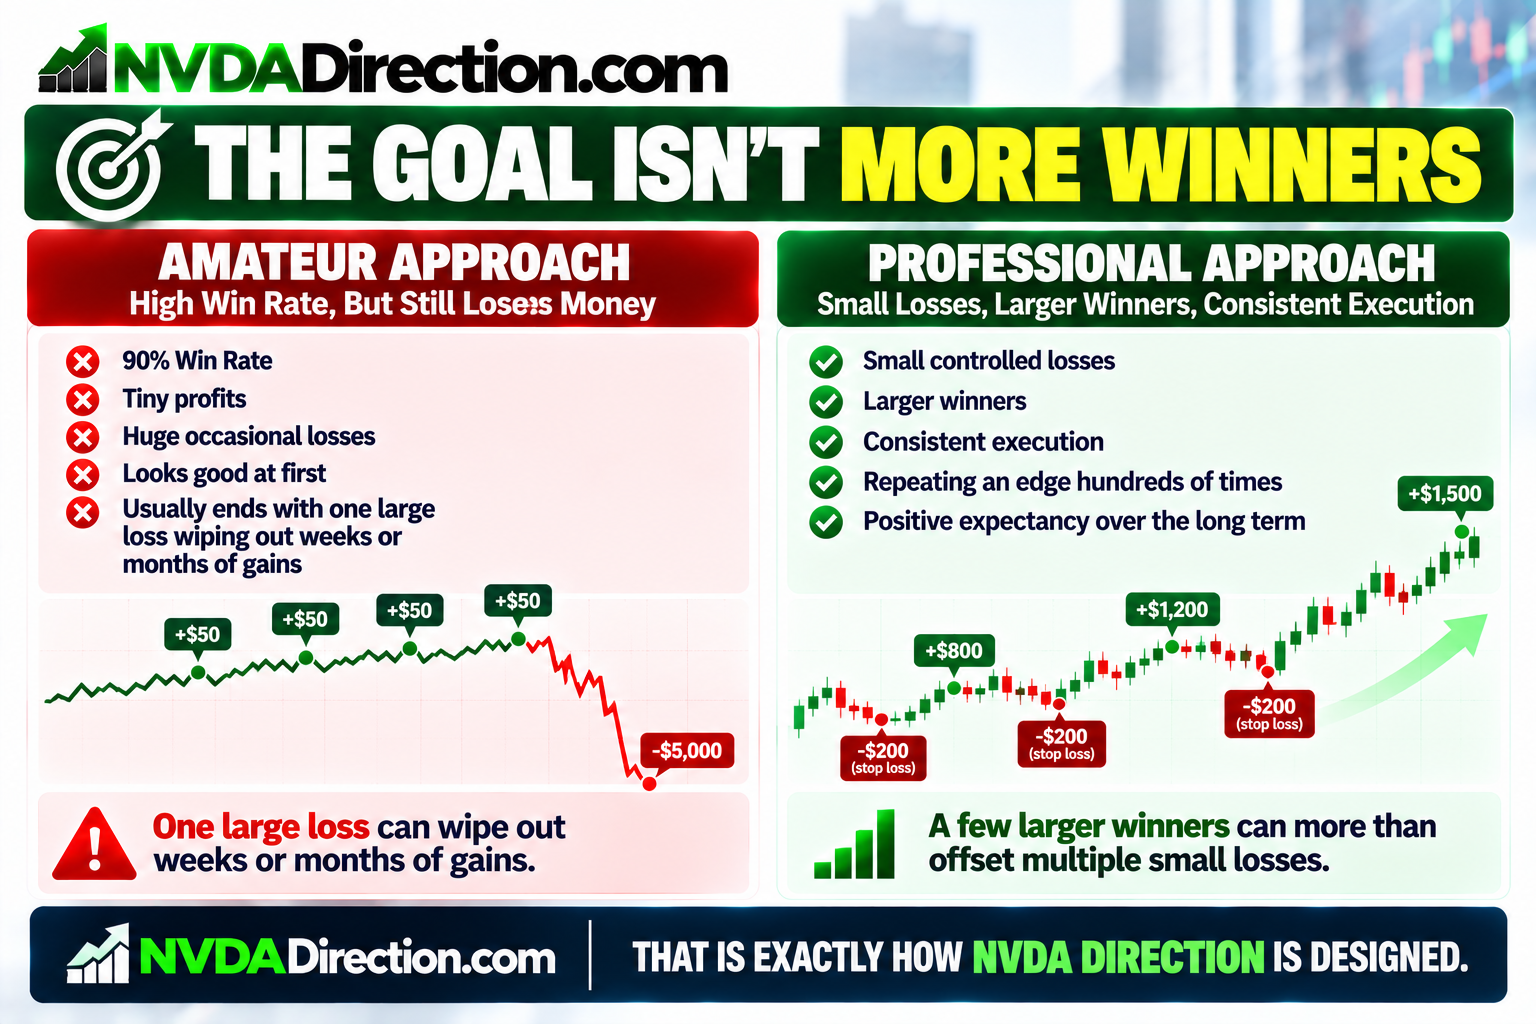
Many new traders think this is success:
- 90% Win Rate
- Tiny profits
- Huge occasional losses
That strategy usually ends with one large loss wiping out weeks or months of gains.
Instead, professional trading focuses on:
- Small controlled losses
- Larger winners
- Consistent execution
- Repeating an edge hundreds of times
That is exactly how NVDA Direction is designed.
Understanding Expectancy
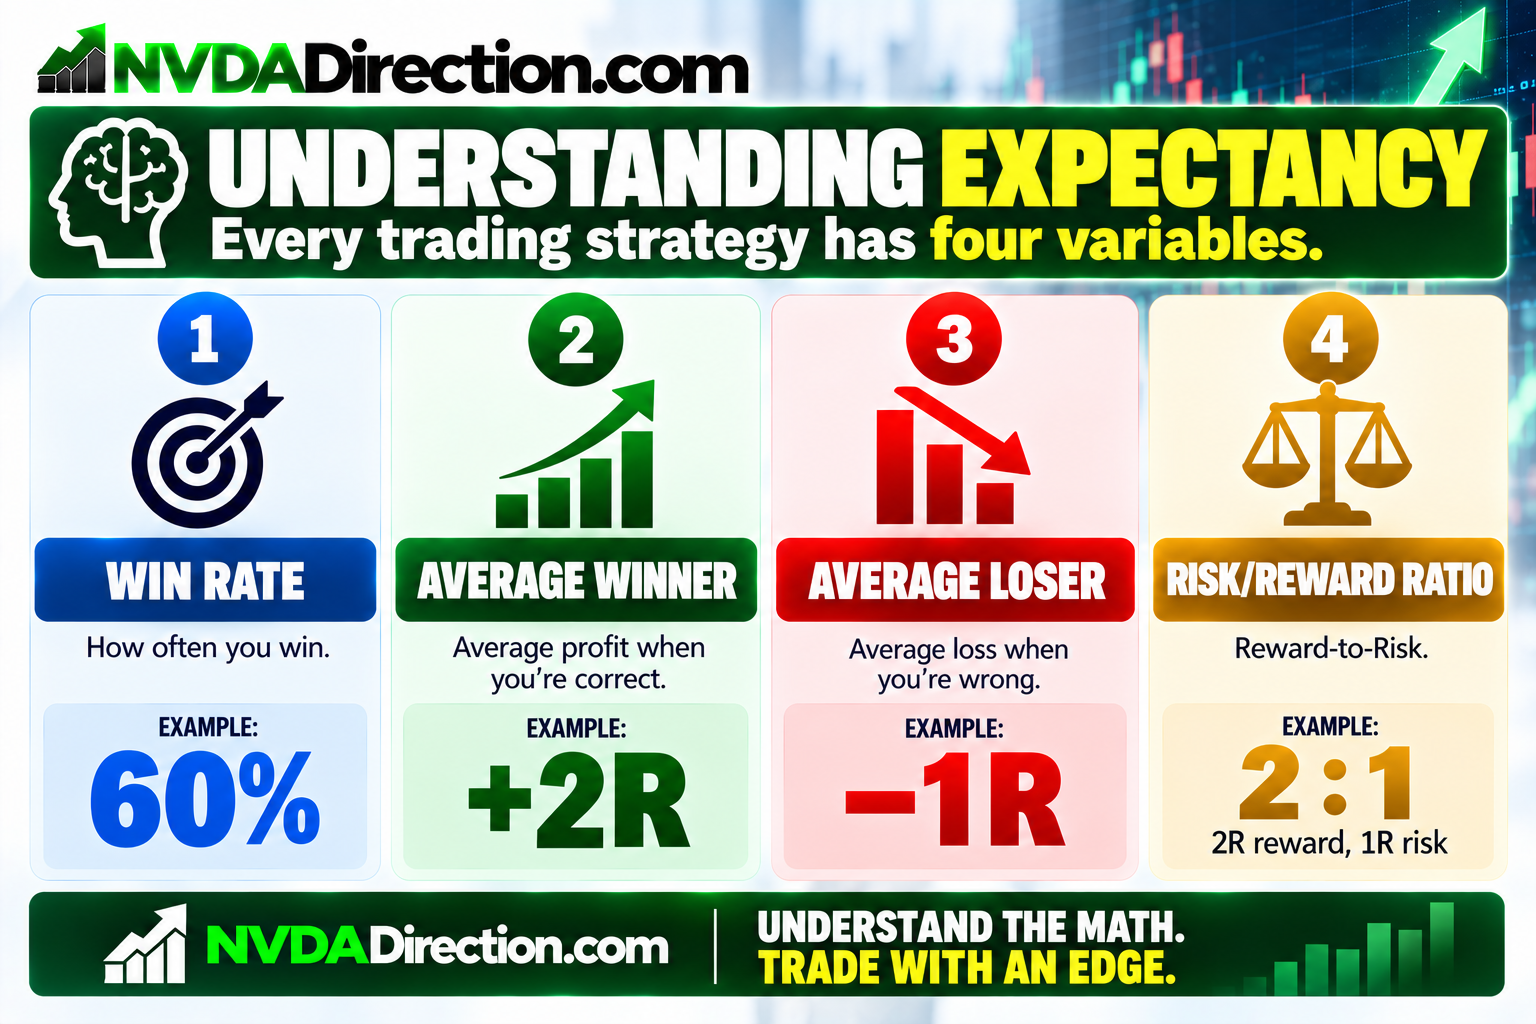
Every trading strategy has four variables.
Win Rate
How often you win.
Example:
60%
Average Winner
Average profit when you're correct.
Example:
+2R
Average Loser
Average loss when you're wrong.
Example:
−1R
Risk/Reward Ratio
2R reward
1R risk
Reward-to-Risk
2 : 1
Example
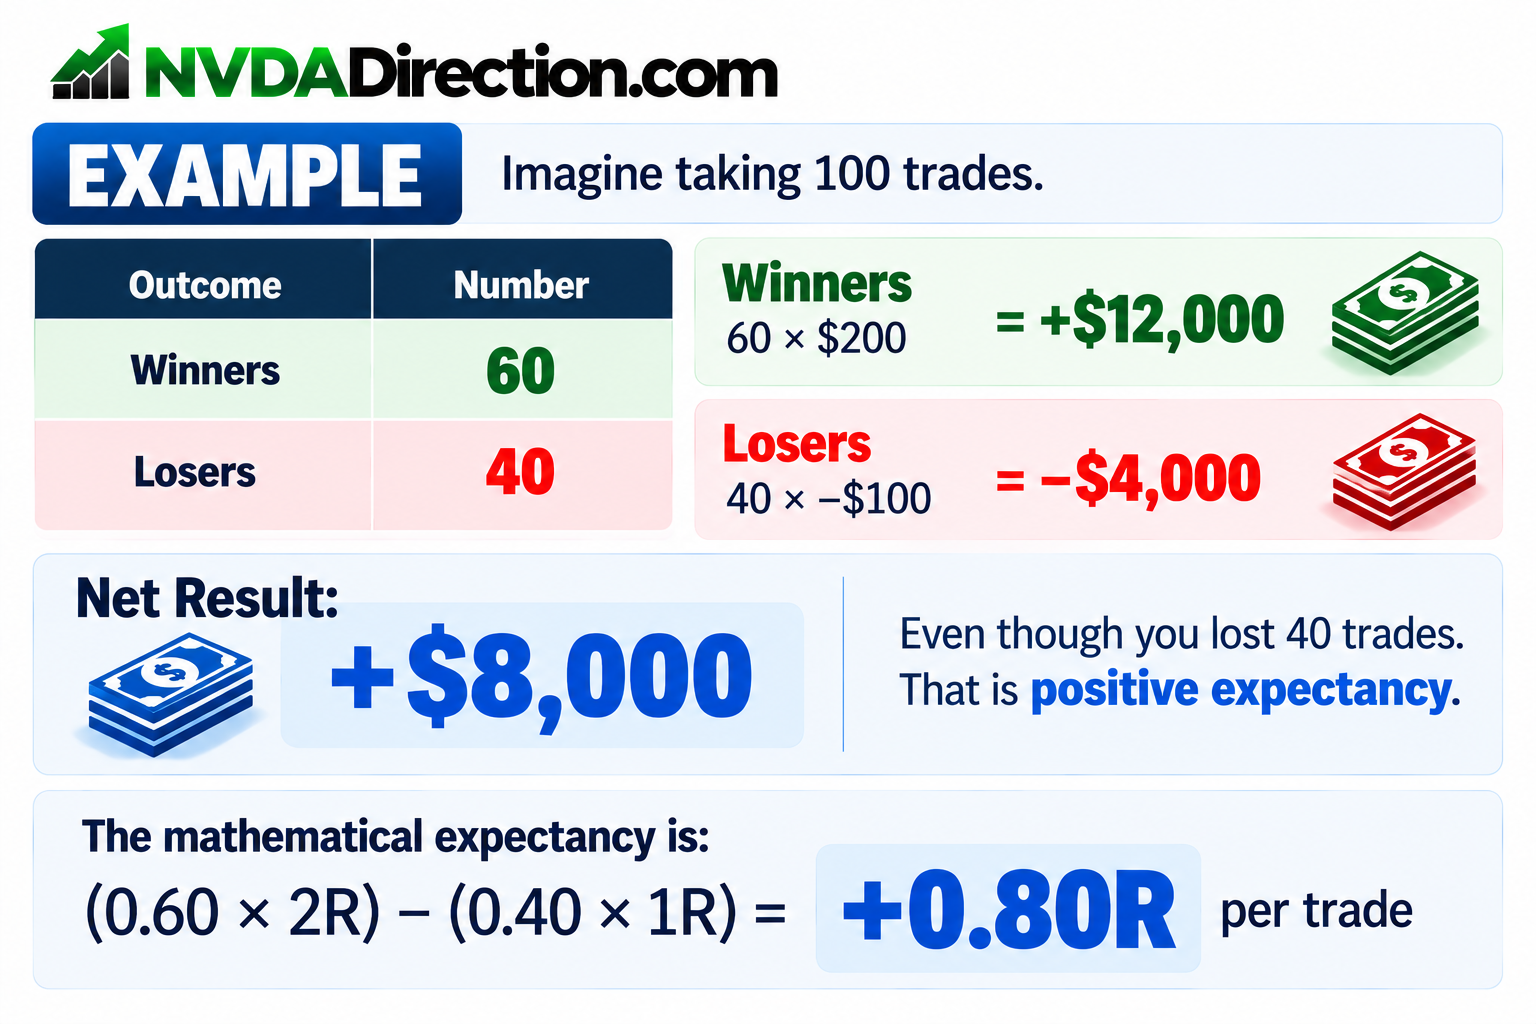
Imagine taking 100 trades.
| Outcome | Number |
|---|---|
| Winners | 60 |
| Losers | 40 |
Winners
60 × $200
= +$12,000
Losers
40 × −$100
= −$4,000
Net Result:
+$8,000
Even though you lost 40 trades.
That is positive expectancy.
The mathematical expectancy is:
(0.60 × 2R) − (0.40 × 1R) = +0.80R per trade
Why This Matters in NVDA Direction
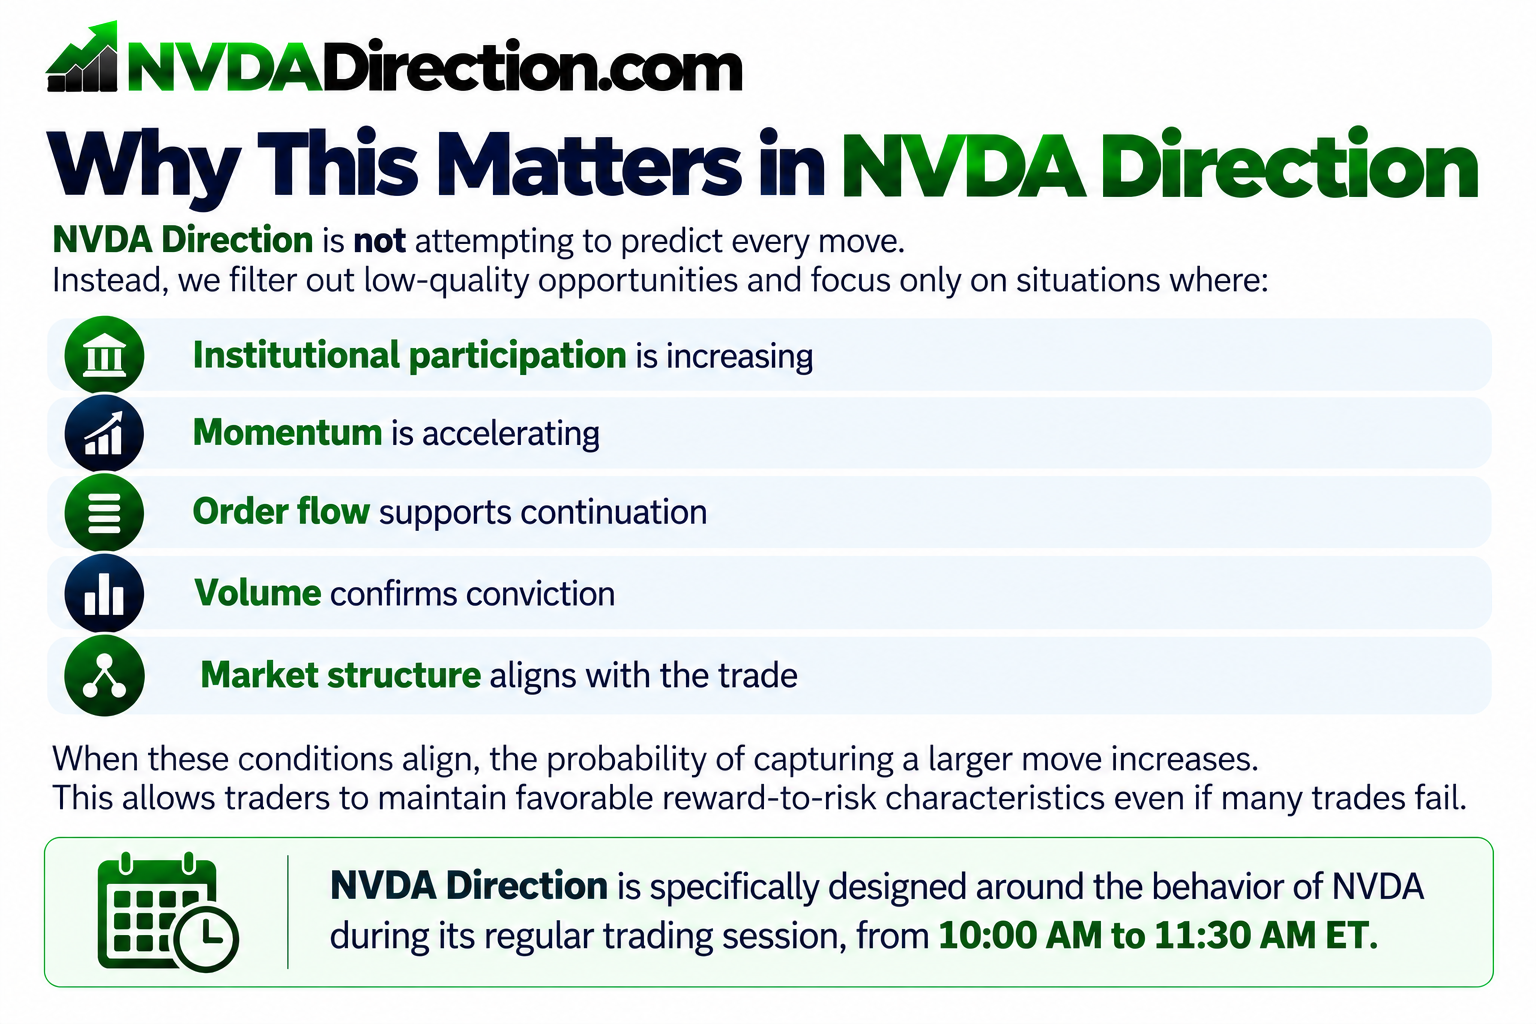
NVDA Direction is not attempting to predict every move.
Instead, we filter out low-quality opportunities and focus only on situations where:
- Institutional participation is increasing
- Momentum is accelerating
- Order flow supports continuation
- Volume confirms conviction
- Market structure aligns with the trade
When these conditions align, the probability of capturing a larger move increases.
This allows traders to maintain favorable reward-to-risk characteristics even if many trades fail.
NVDA Direction is specifically designed around the behavior of NVDA during its regular trading session, from 10:00 AM to 11:30 AM ET.
How NVDA Direction Builds Positive Expectancy
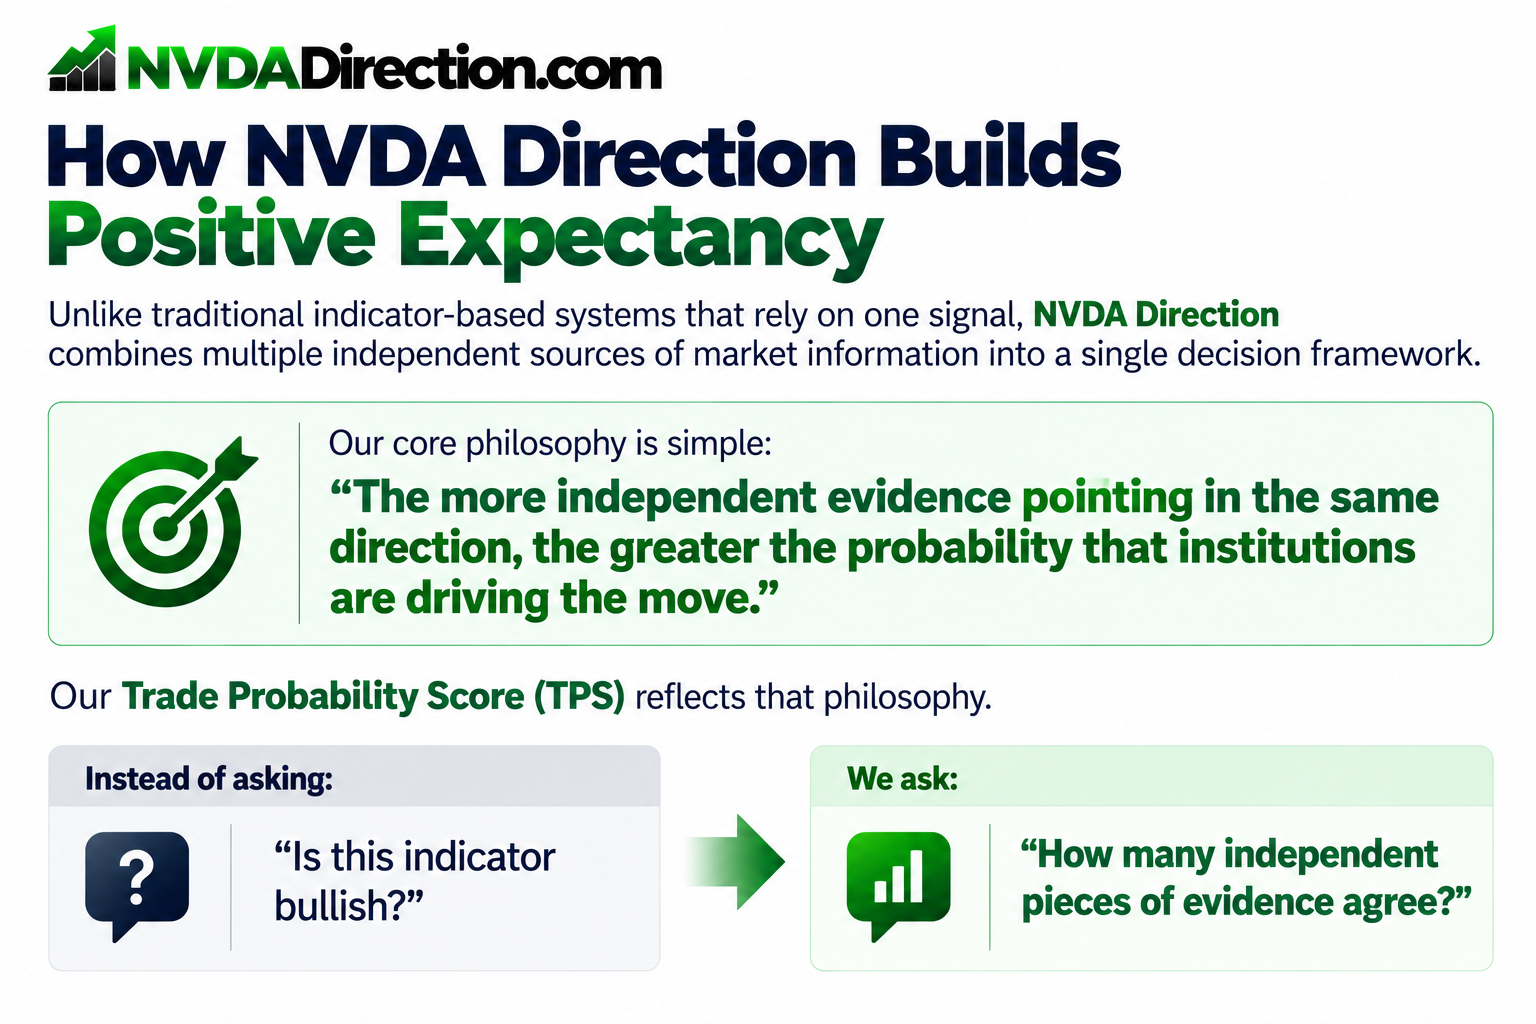
Unlike traditional indicator-based systems that rely on one signal, NVDA Direction combines multiple independent sources of market information into a single decision framework.
Our core philosophy is simple:
The more independent evidence pointing in the same direction, the greater the probability that institutions are driving the move.
Our Trade Probability Score (TPS) reflects that philosophy.
Instead of asking:
"Is this indicator bullish?"
We ask:
"How many independent pieces of evidence agree?"
Our Core Edge
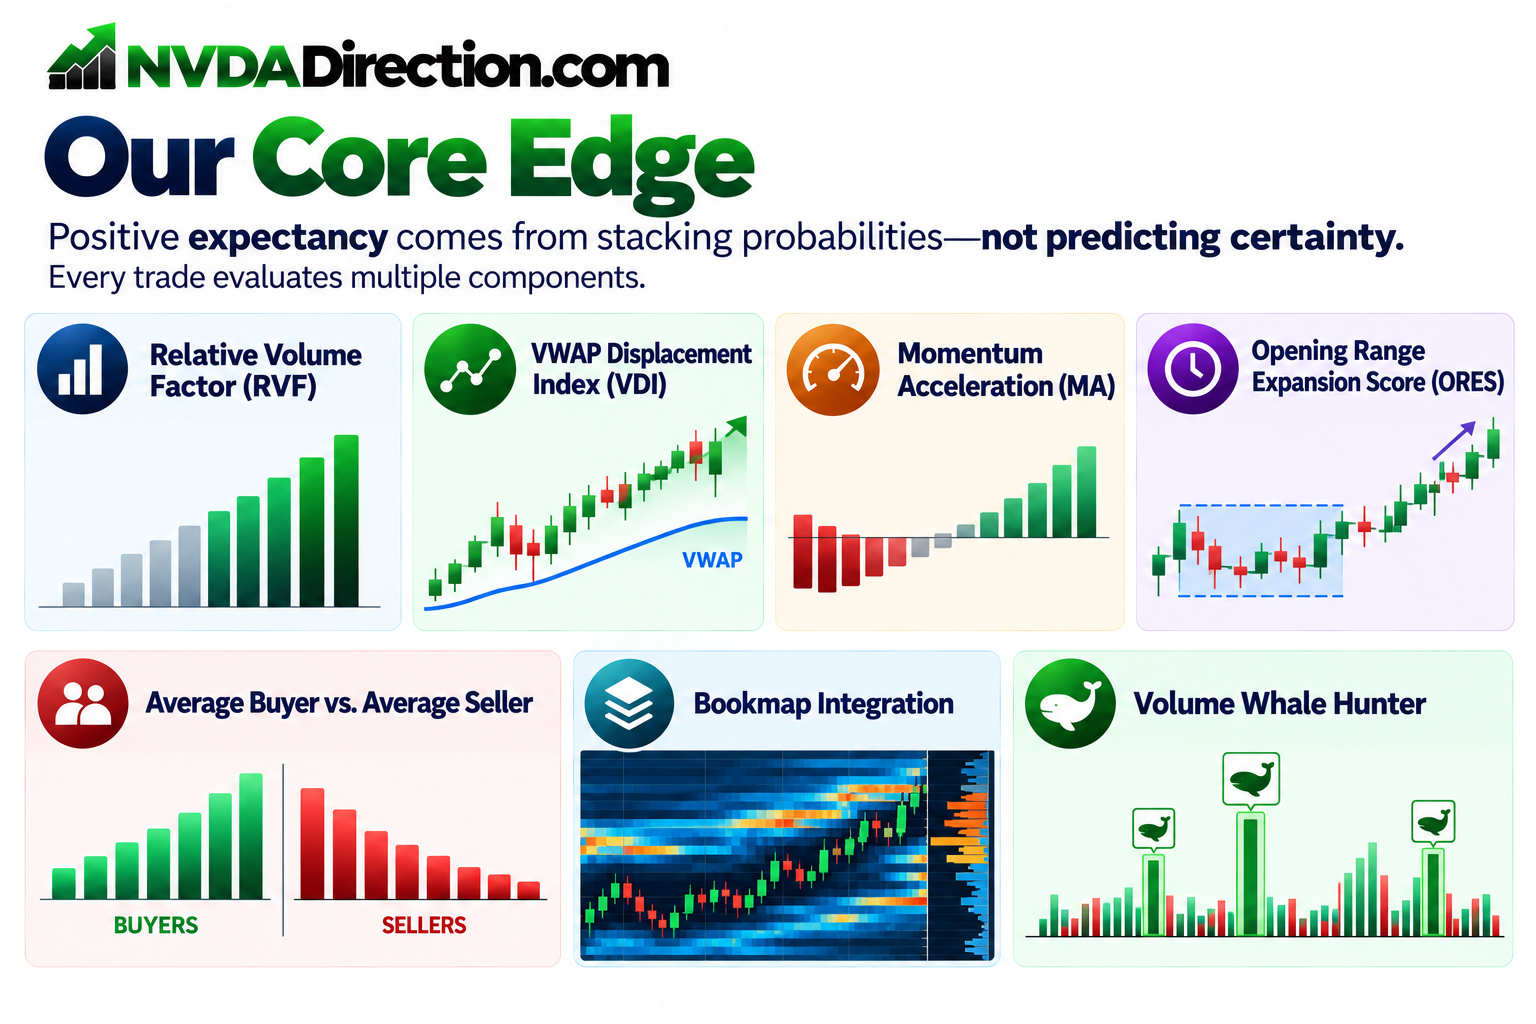
Positive expectancy comes from stacking probabilities—not predicting certainty.
Every trade evaluates multiple components.
RVF measures whether current NVDA participation is elevated relative to normal volume conditions.
The current NVDA Direction levels are:
- RVF < 0.80 → weak participation
- RVF 0.80–1.10 → normal/baseline participation
- RVF ≥ 1.10 → elevated participation
- RVF ≥ 1.40 → strong institutional participation
High RVF suggests that meaningful participation is supporting the move.
Without participation...
Momentum rarely lasts.
VDI measures whether NVDA is genuinely separating from fair value or simply oscillating around VWAP.
The current NVDA Direction levels are:
- VDI ≥ +1.0 → Bullish
- VDI > +0.5 → Mild Bull
- VDI −0.5 to +0.5 → Balance
- VDI ≤ −0.5 → Mild Bear
- VDI ≤ −1.0 → Bearish
Strong displacement often precedes sustained directional movement.
Markets rarely trend because price is moving.
They trend because momentum is increasing.
Momentum Acceleration identifies whether buying or selling pressure is strengthening—not merely existing.
For NVDA Direction:
- MA > 0 → accelerating
- MA < 0 → decelerating
Opening Range Expansion Score (ORES)
The opening range contains some of the highest institutional activity of the NVDA trading session.
ORES measures whether that early auction is producing genuine expansion or compressed opening behavior.
The current NVDA Direction levels are:
- ORES < 0.70 → Compressed
- ORES 0.70–1.29 → Normal
- ORES ≥ 1.30 → High Institutional
High ORES can indicate stronger opening intent and greater potential for continuation.
Average Buyer vs. Average Seller
This reveals who is actually winning the battle.
Instead of watching candles alone, traders see whether buyers are consistently overpowering sellers.
Bookmap Integration
Bookmap provides visibility into:
- Hidden liquidity
- Absorption
- Aggressive buying
- Aggressive selling
- Iceberg orders
These provide confirmation that institutions—not retail traders—are influencing price.
Large traders leave footprints.
Volume Whale Hunter identifies unusual block activity that frequently precedes directional moves.
Institutional footprints matter more than retail sentiment.
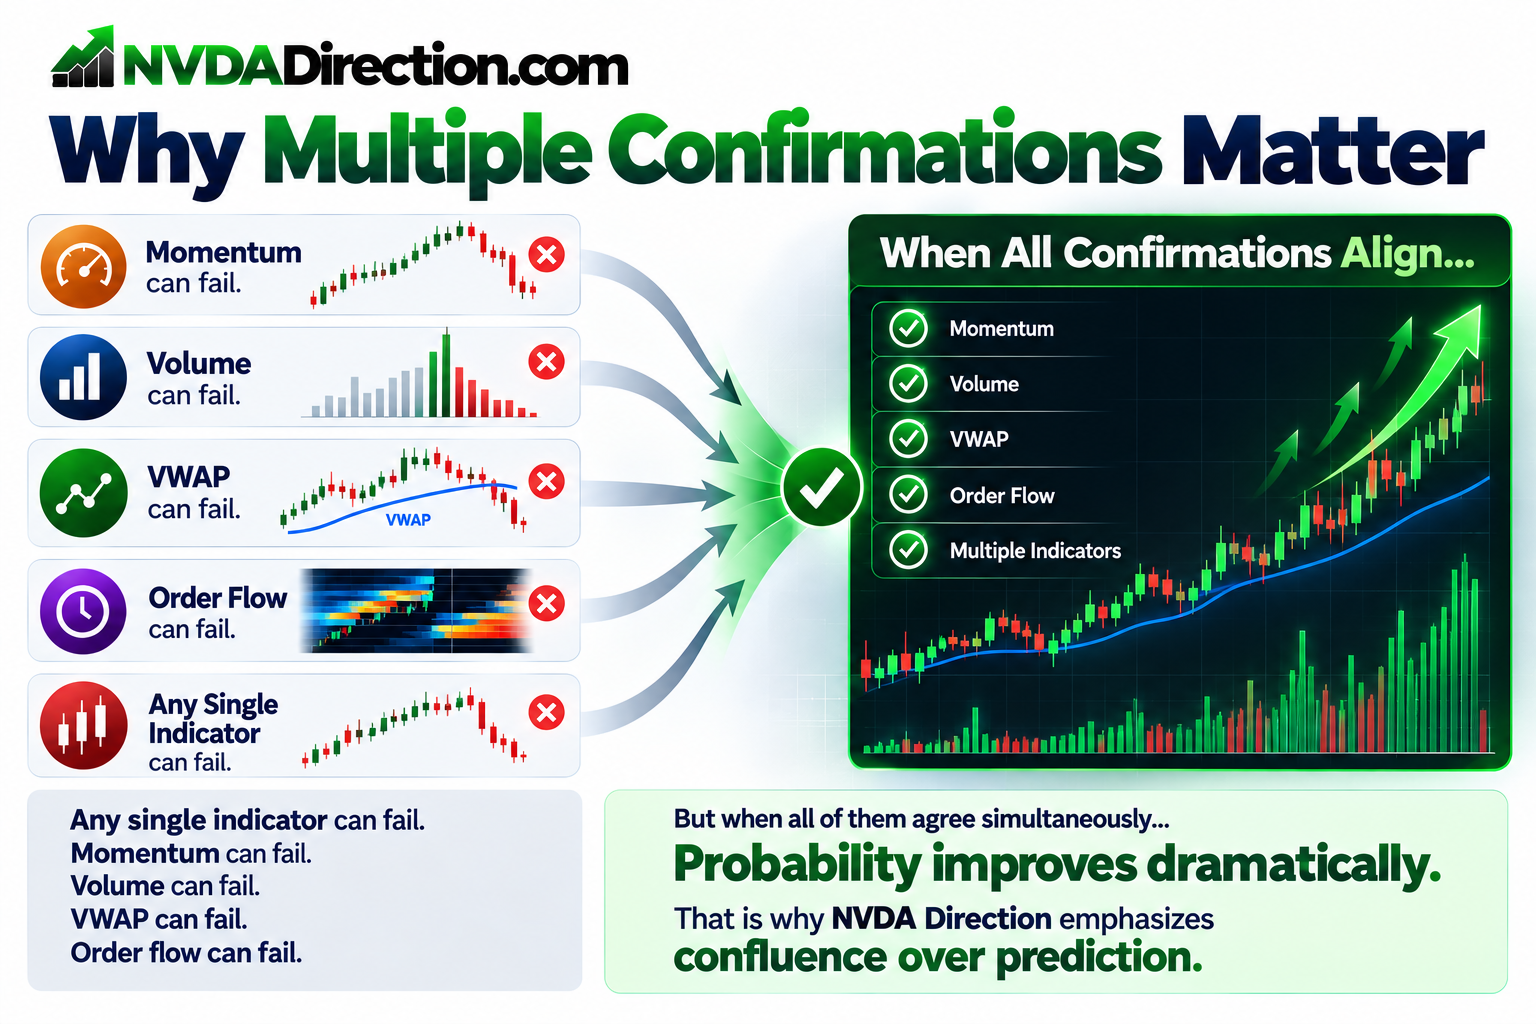
Why Multiple Confirmations Matter
Any single indicator can fail.
Momentum can fail.
Volume can fail.
VWAP can fail.
Order flow can fail.
But when all of them agree simultaneously...
Probability improves dramatically.
That is why NVDA Direction emphasizes confluence over prediction.
Trade Probability Score (TPS)
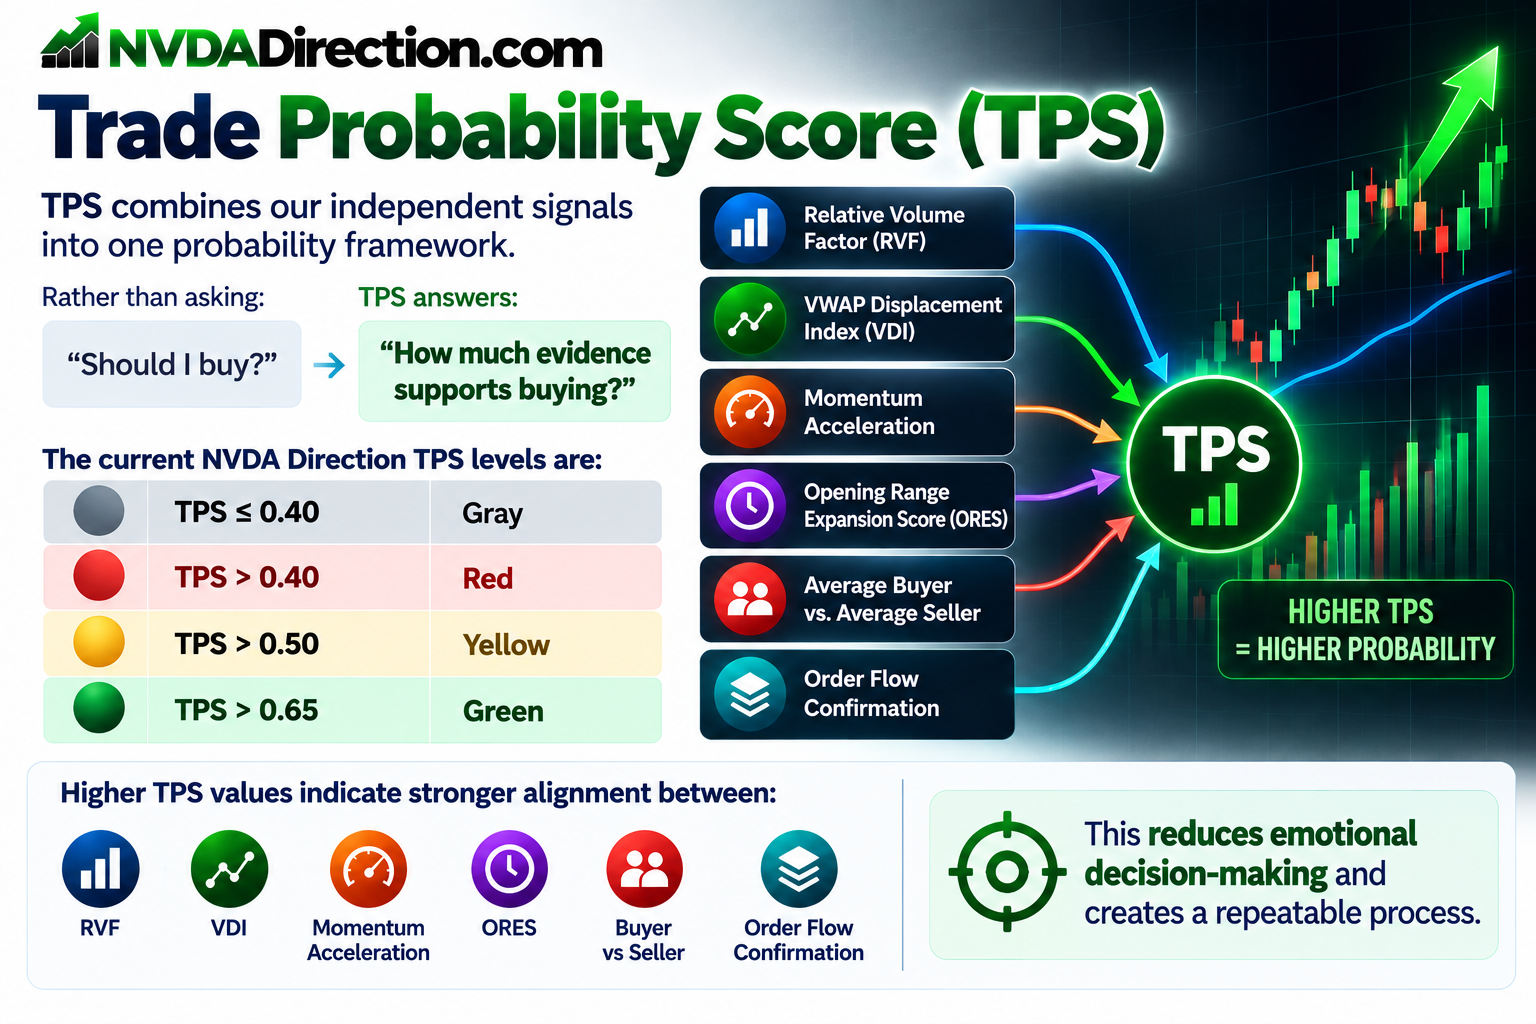
TPS combines our independent signals into one probability framework.
Rather than asking:
"Should I buy?"
TPS answers:
"How much evidence supports buying?"
The current NVDA Direction TPS levels are:
- TPS ≤ 0.40 → Gray
- TPS > 0.40 → Red
- TPS > 0.50 → Yellow
- TPS > 0.65 → Green
Higher TPS values indicate stronger alignment between:
- RVF
- VDI
- Momentum Acceleration
- ORES
- Buyer vs Seller
- Order Flow Confirmation
This reduces emotional decision-making and creates a repeatable process.
Our Objective Is Not a Perfect Win Rate
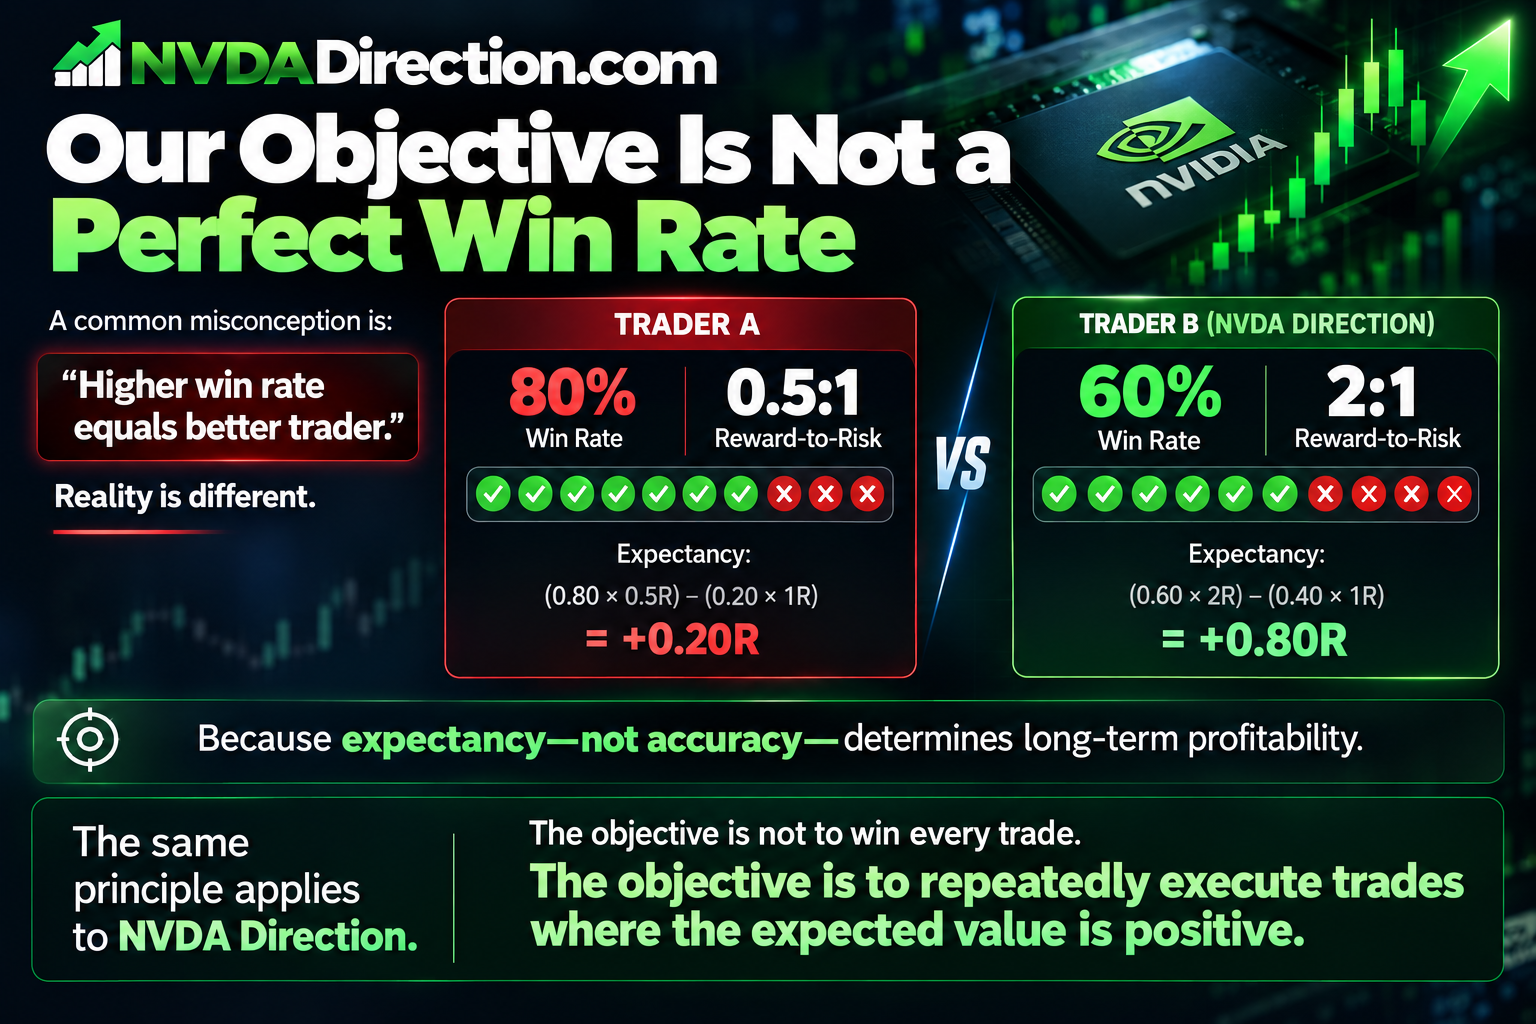
A common misconception is:
Higher win rate equals better trader.
Reality is different.
A trader with:
- 40% wins
- 3:1 reward-to-risk
can outperform someone with:
- 80% wins
- 0.5:1 reward-to-risk
because expectancy—not accuracy—determines long-term profitability.
The same principle applies to NVDA Direction.
A 60% win rate with a 2:1 reward-to-risk profile produces positive expectancy:
(0.60 × 2R) − (0.40 × 1R) = +0.80R
The objective is not to win every trade.
The objective is to repeatedly execute trades where the expected value is positive.
Capital Preservation Is the Foundation
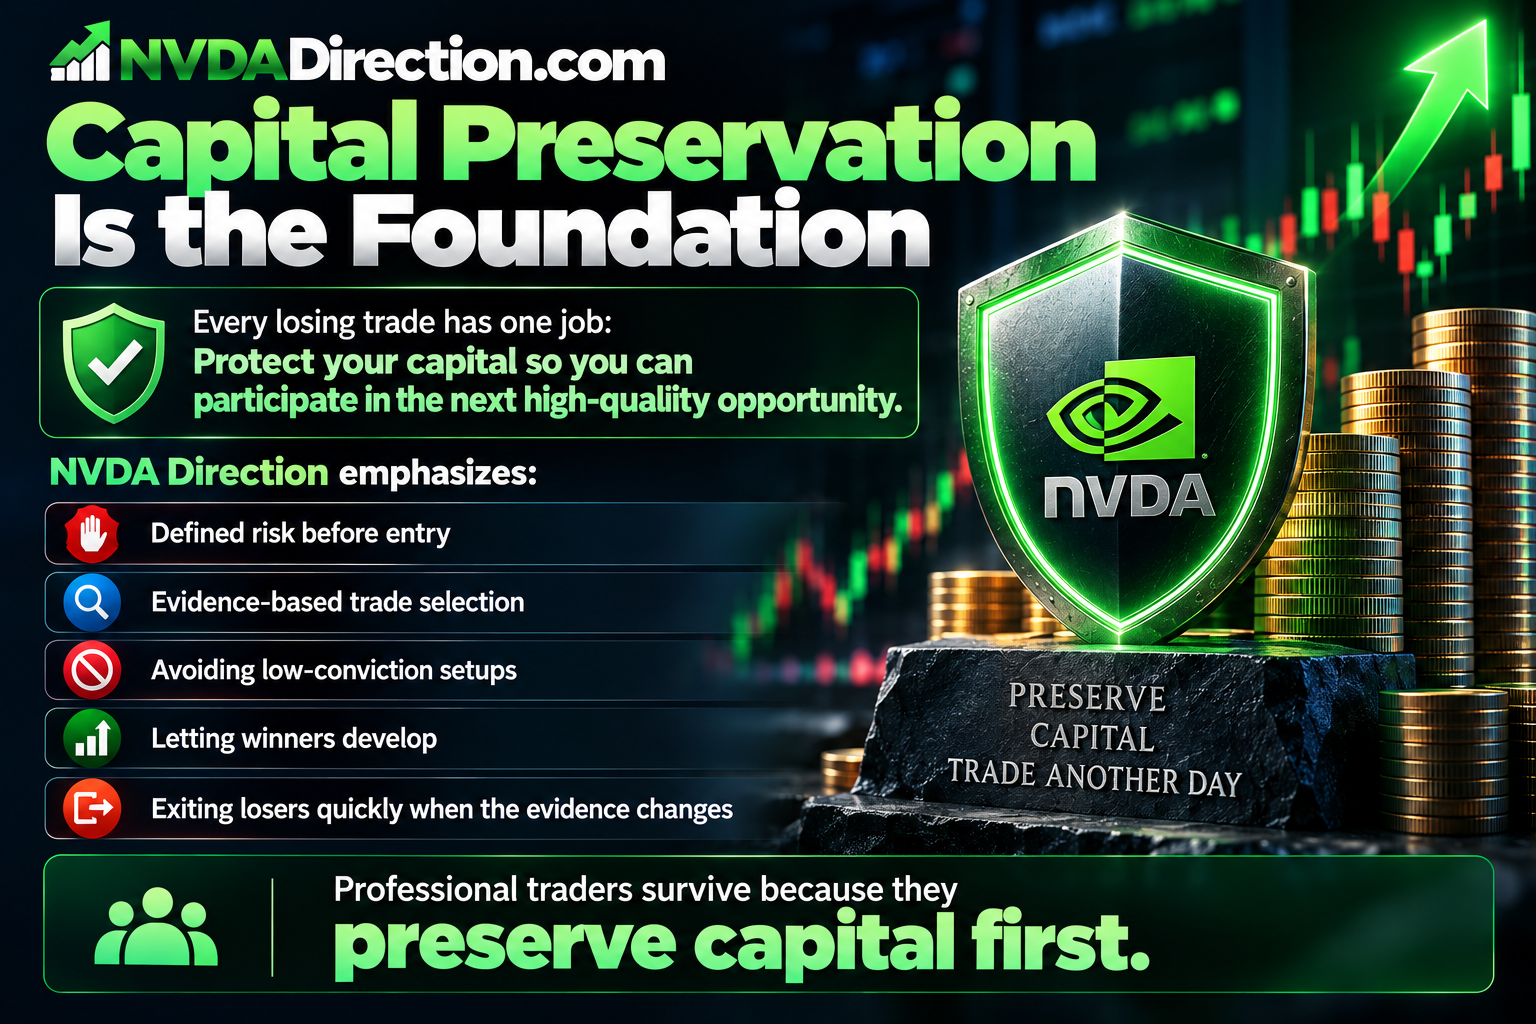
Every losing trade has one job:
Protect your capital so you can participate in the next high-quality opportunity.
NVDA Direction emphasizes:
- Defined risk before entry
- Evidence-based trade selection
- Avoiding low-conviction setups
- Letting winners develop
- Exiting losers quickly when the evidence changes
Professional traders survive because they preserve capital first.
Compounding Small Edges
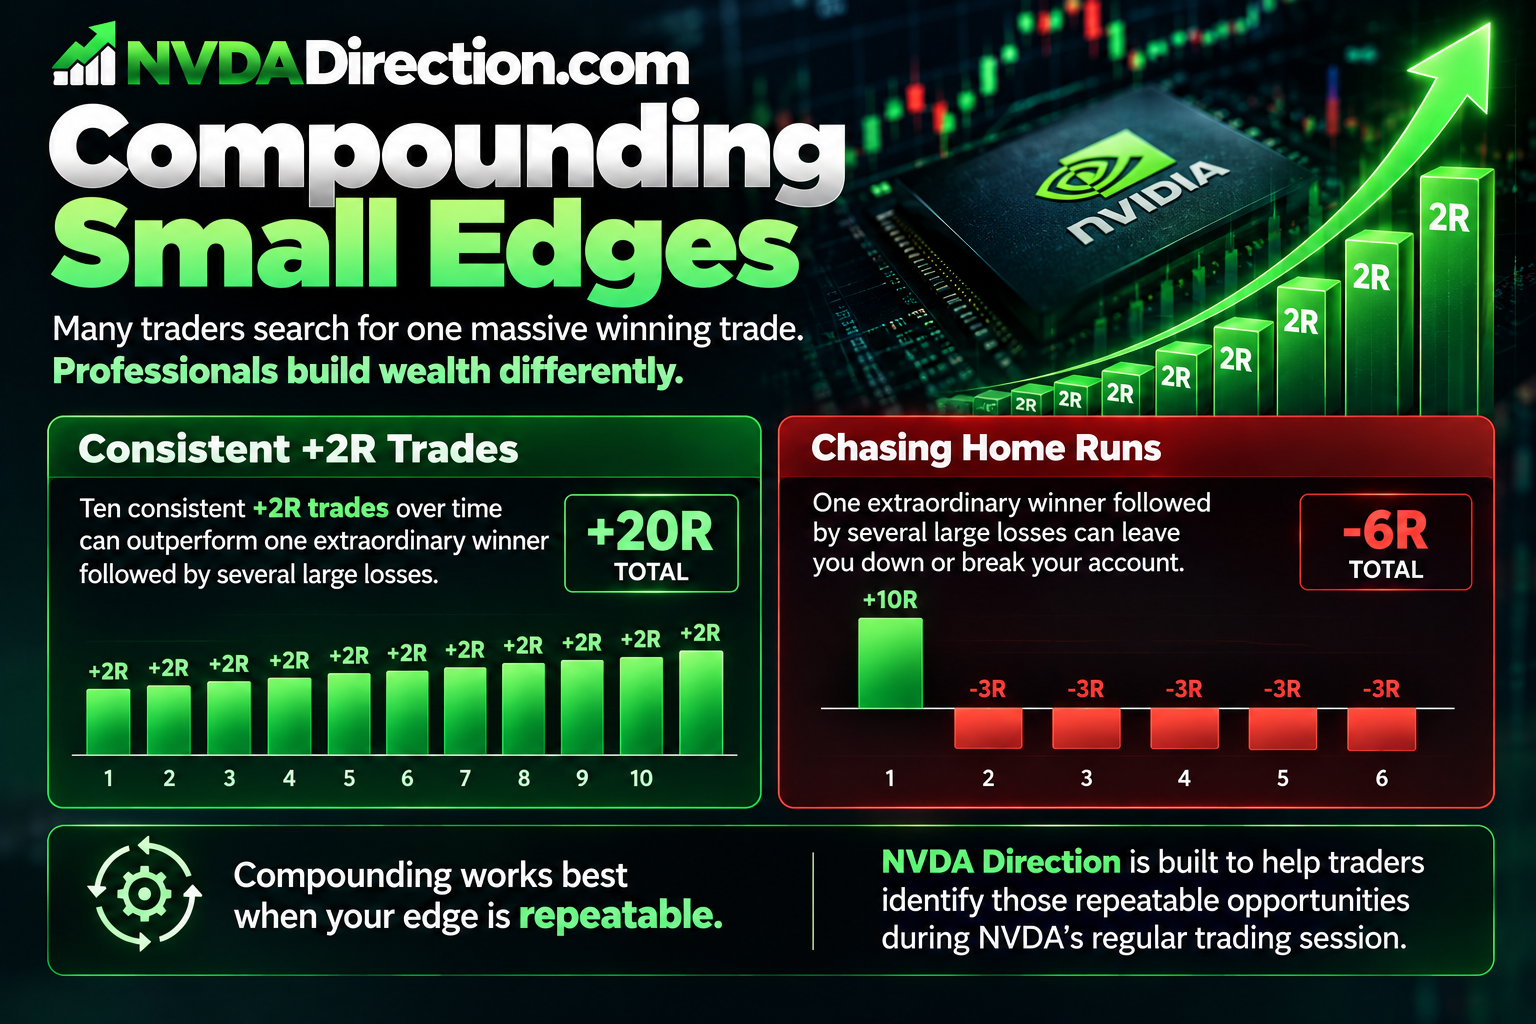
Many traders search for one massive winning trade.
Professionals build wealth differently.
Instead of chasing home runs, they repeatedly execute high-quality setups.
For example:
- Ten consistent +2R trades over time can outperform one extraordinary winner followed by several large losses.
Compounding works best when your edge is repeatable.
NVDA Direction is built to help traders identify those repeatable opportunities during NVDA's regular trading session.
Practical Application Within NVDA Direction
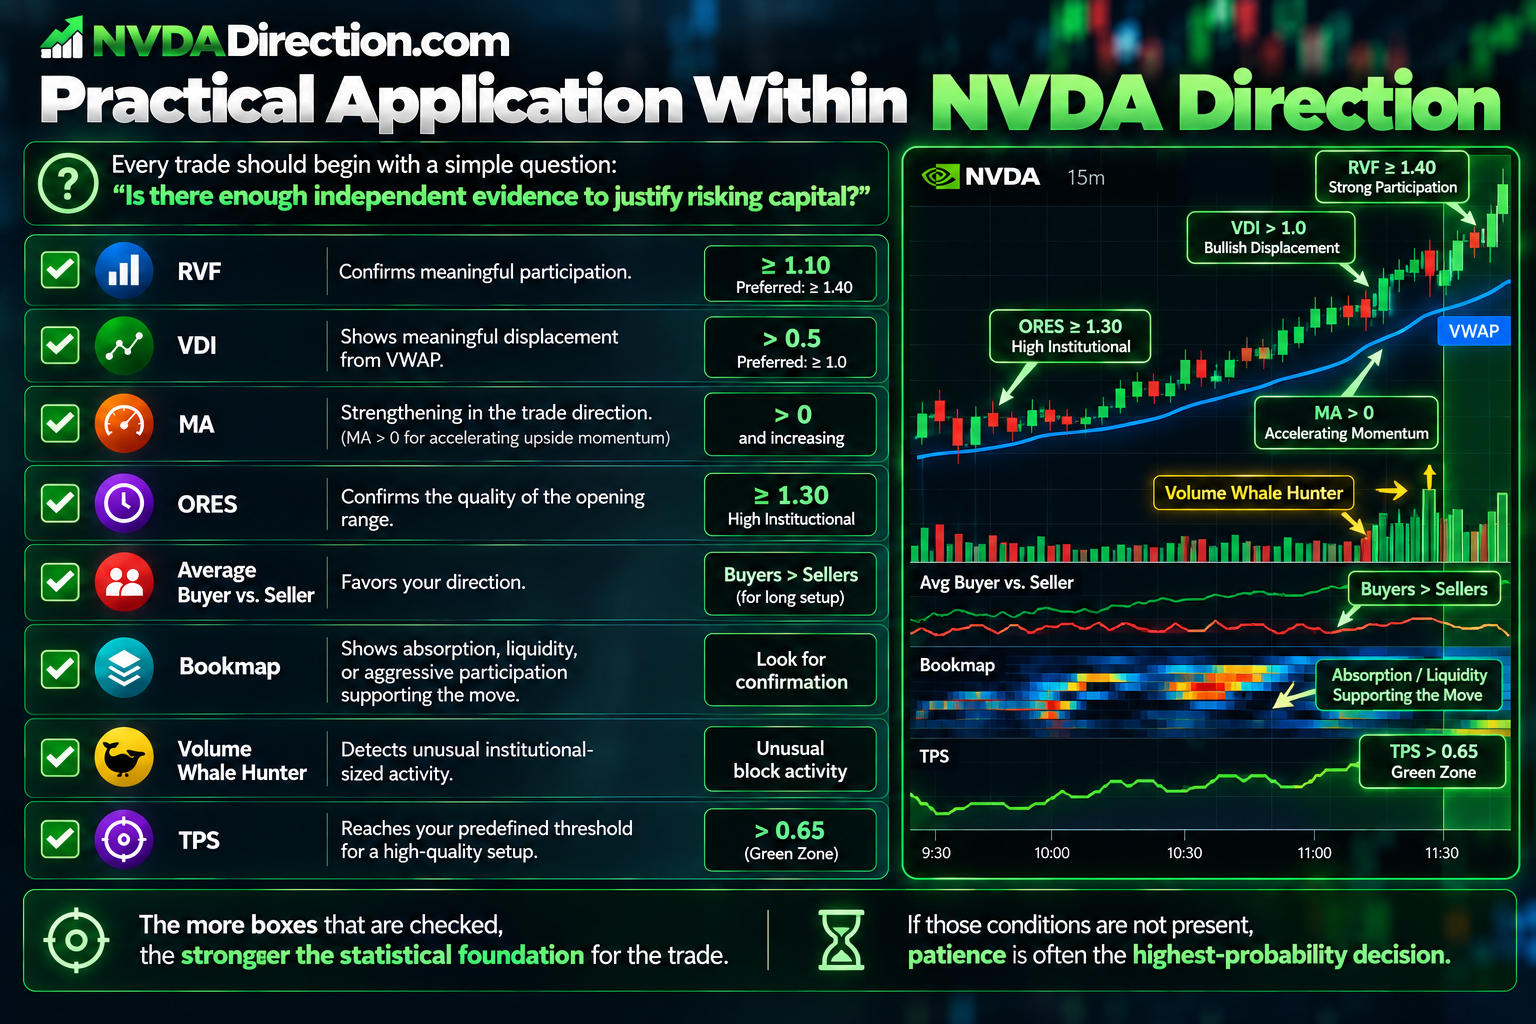
Every trade should begin with a simple question:
Is there enough independent evidence to justify risking capital?
Before entering a position, look for alignment across the NVDA Direction framework:
- ✓ RVF confirms meaningful participation, preferably ≥ 1.10, with ≥ 1.40 representing the strongest participation conditions.
- ✓ VDI shows meaningful displacement from VWAP.
- ✓ Momentum Acceleration is strengthening in the trade direction (MA > 0 for accelerating upside momentum).
- ✓ ORES confirms the quality of the opening range, with ≥ 1.30 indicating High Institutional conditions.
- ✓ Average Buyer vs. Seller favors your direction.
- ✓ Bookmap shows absorption, liquidity, or aggressive participation supporting the move.
- ✓ Volume Whale Hunter detects unusual institutional-sized activity.
- ✓ TPS reaches your predefined threshold for a high-quality setup, with >0.65 representing the green zone.
The more boxes that are checked, the stronger the statistical foundation for the trade. If those conditions are not present, patience is often the highest-probability decision.
Key Takeaways
- Winning percentage alone does not determine profitability.
- Positive expectancy is the foundation of long-term success.
- Risk management protects the capital needed to exploit future opportunities.
- NVDA Direction is built around probability, not prediction.
- TPS combines multiple independent signals to improve trade selection.
- Institutional participation is the primary driver behind sustainable market moves.
- RVF ≥ 1.10 indicates elevated participation, while ≥ 1.40 represents strong participation.
- VDI identifies whether NVDA is meaningfully displaced from VWAP and in which direction.
- MA > 0 indicates accelerating momentum, while MA < 0 indicates decelerating momentum.
- ORES ≥ 1.30 identifies High Institutional opening conditions.
- TPS > 0.65 represents the strongest current TPS zone.
- Consistently executing high-quality setups produces better long-term results than chasing perfect trades.
- Small, repeatable edges compounded over hundreds of trades are far more valuable than occasional home runs.
The NVDA Direction Philosophy
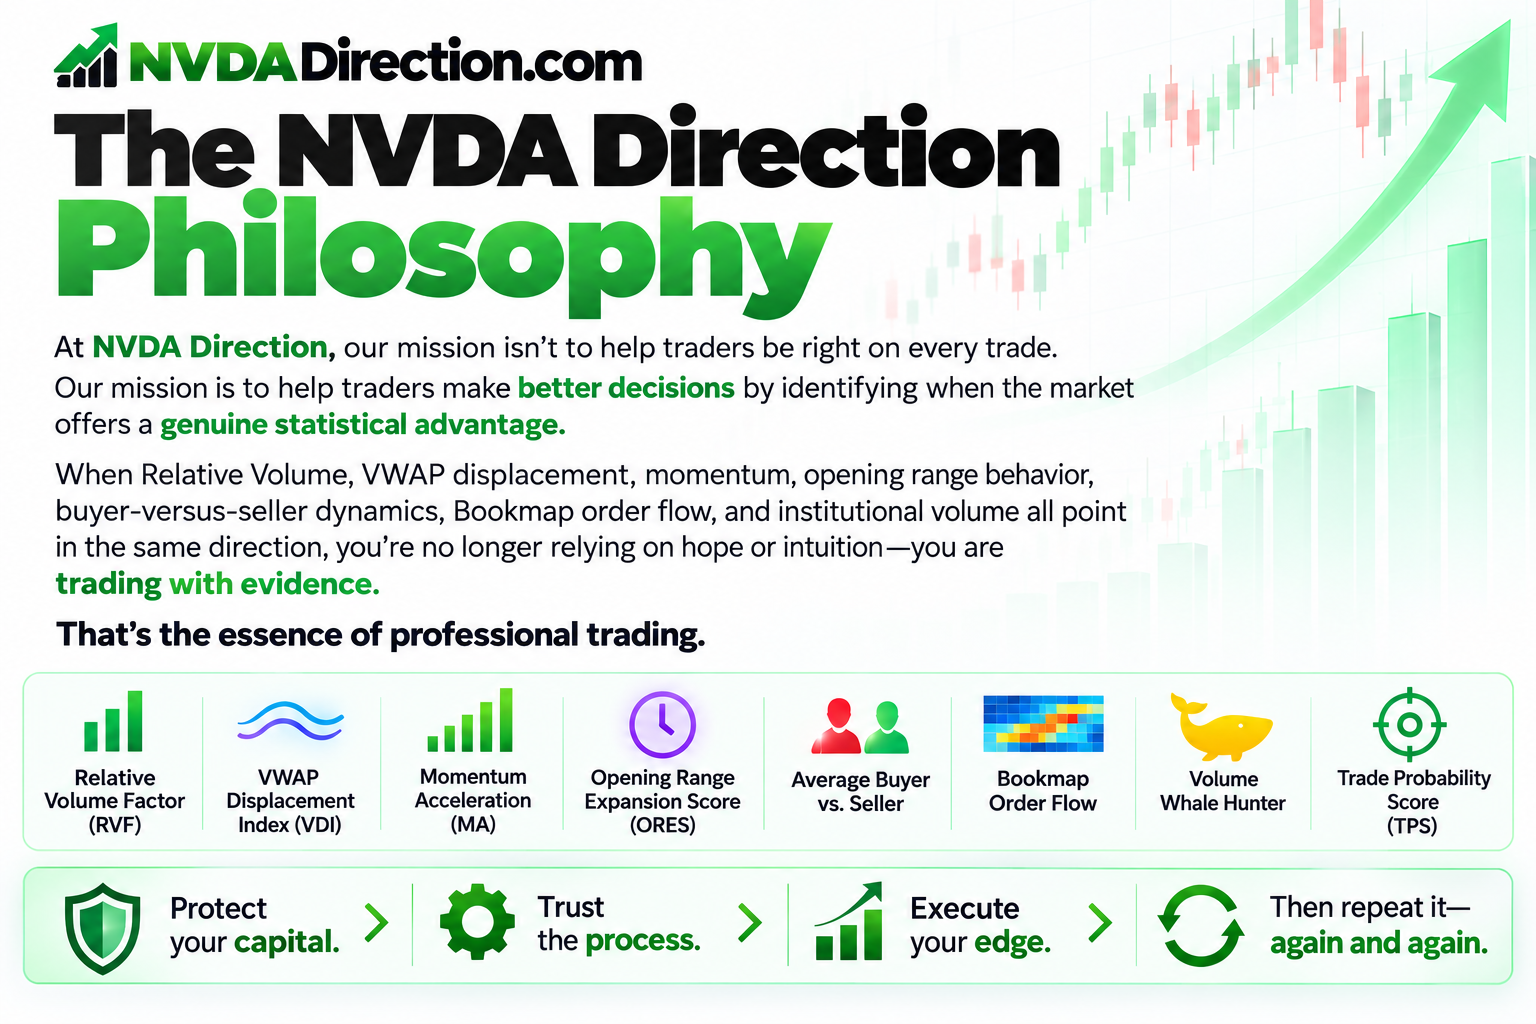
At NVDA Direction, our mission isn't to help traders be right on every trade.
Our mission is to help traders make better decisions by identifying when the market offers a genuine statistical advantage.
When Relative Volume, VWAP displacement, momentum, opening range behavior, buyer-versus-seller dynamics, Bookmap order flow, and institutional volume all point in the same direction, you're no longer relying on hope or intuition—you are trading with evidence.
That's the essence of professional trading.
Protect your capital. Trust the process. Execute your edge. Then repeat it—again and again.