VWAP Displacement Index (VDI)
Contact customer support at support@nvdadirection.com
VWAP Displacement Index (VDI)
Measures how far price is from VWAP, normalized by short-term volatility
🧠 FORMULA
VDI = (Price − VWAP) ÷ ATR(5m)
- Uses 5-minute ATR
- Gives you standardized distance from value (VWAP)
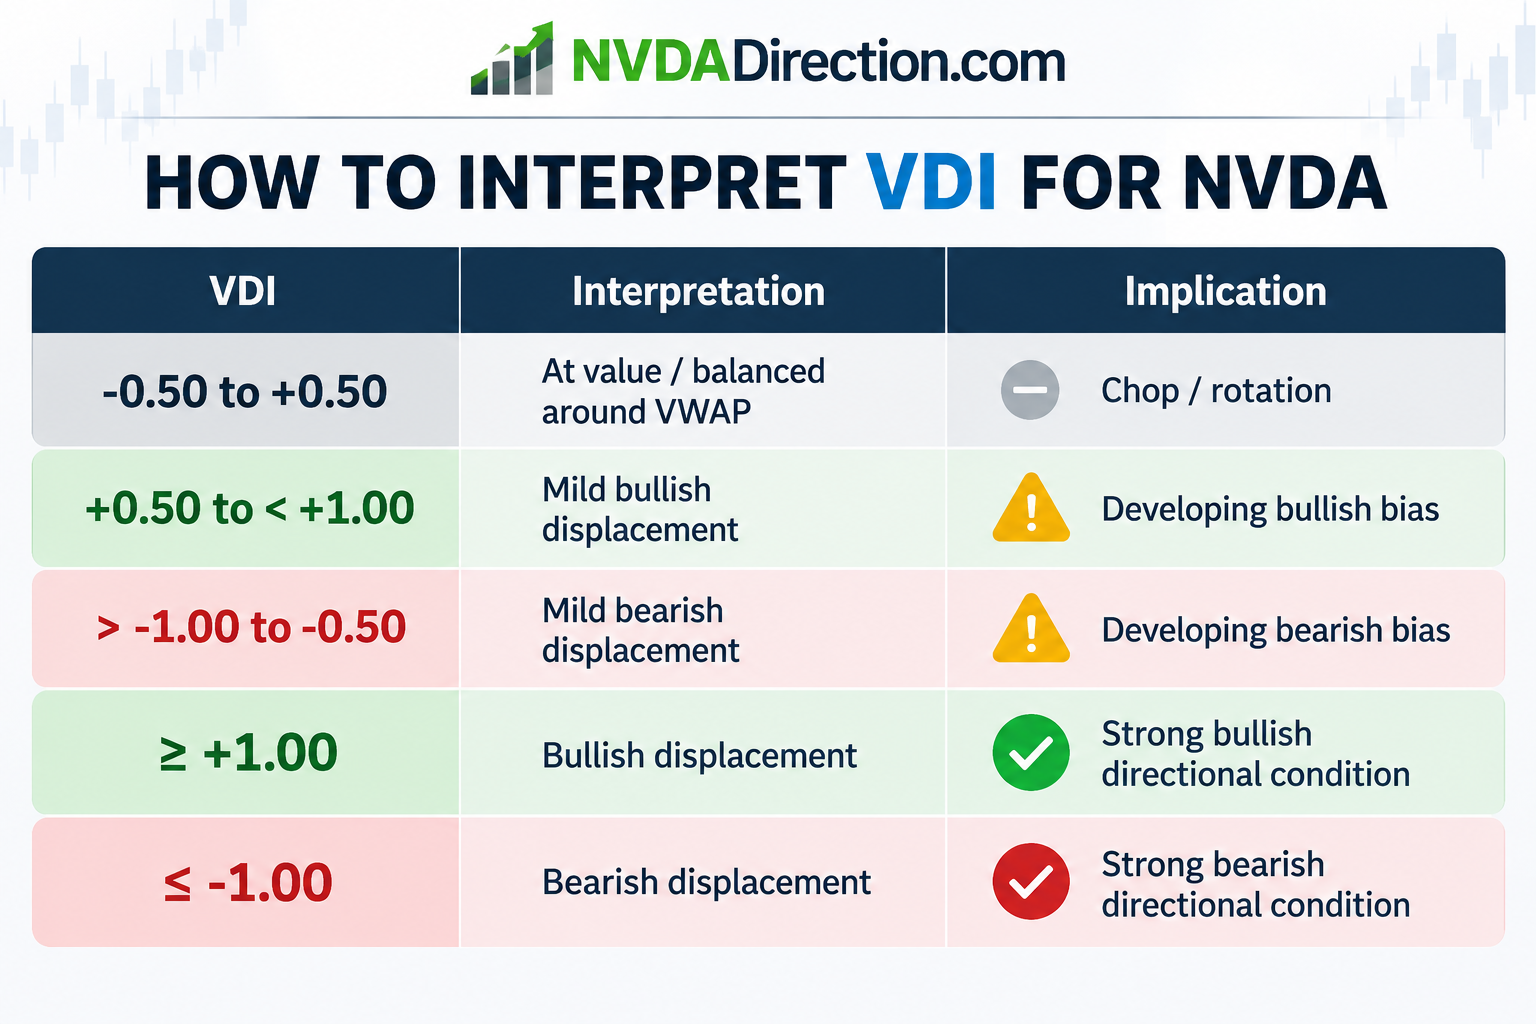
📊 HOW TO INTERPRET VDI FOR NVDA
| VDI | Interpretation | Implication |
|---|---|---|
| -0.50 to +0.50 | At value / balanced around VWAP | ❌ Chop / rotation |
| +0.50 to < +1.00 | Mild bullish displacement | ⚠️ Developing bullish bias |
| > -1.00 to -0.50 | Mild bearish displacement | ⚠️ Developing bearish bias |
| ≥ +1.00 | Bullish displacement | ✅ Strong bullish directional condition |
| ≤ -1.00 | Bearish displacement | ✅ Strong bearish directional condition |
Never Miss a VDI Signal
NVDA Direction can automatically send a text message whenever your selected VDI thresholds are reached.
Learn how to enable SMS Alerts
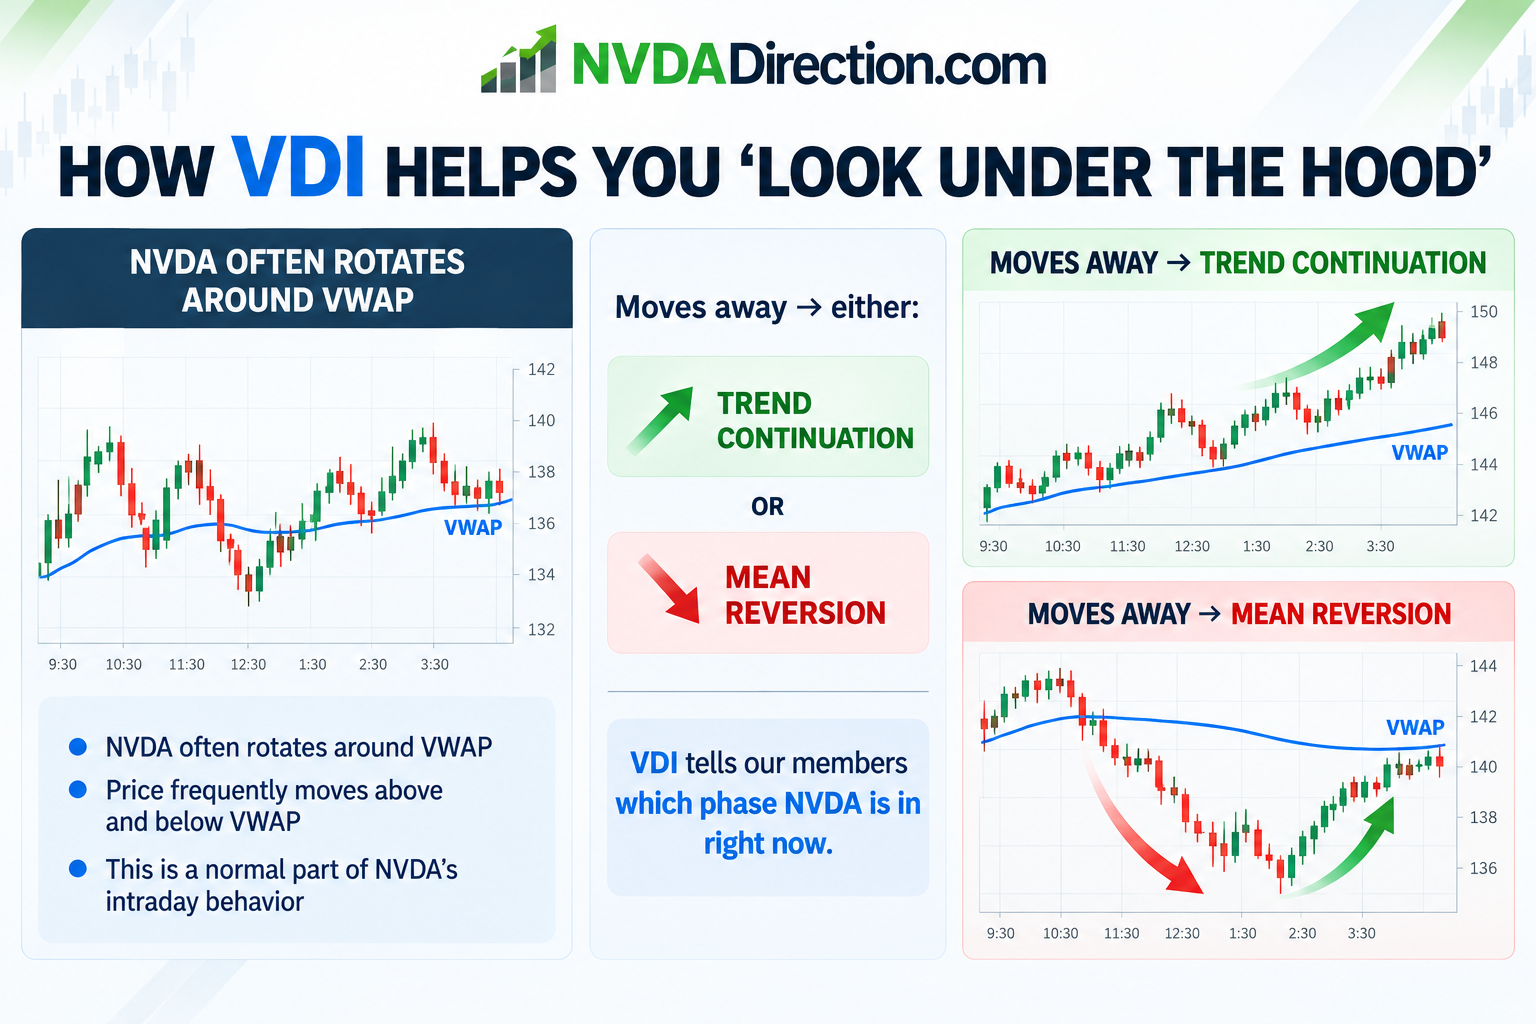
🧠 HOW VDI HELPS YOU ‘LOOK UNDER THE HOOD’
- NVDA often rotates around VWAP
- Moves away → either:
- trend continuation
- OR mean reversion
VDI tells our members which phase NVDA is in right now
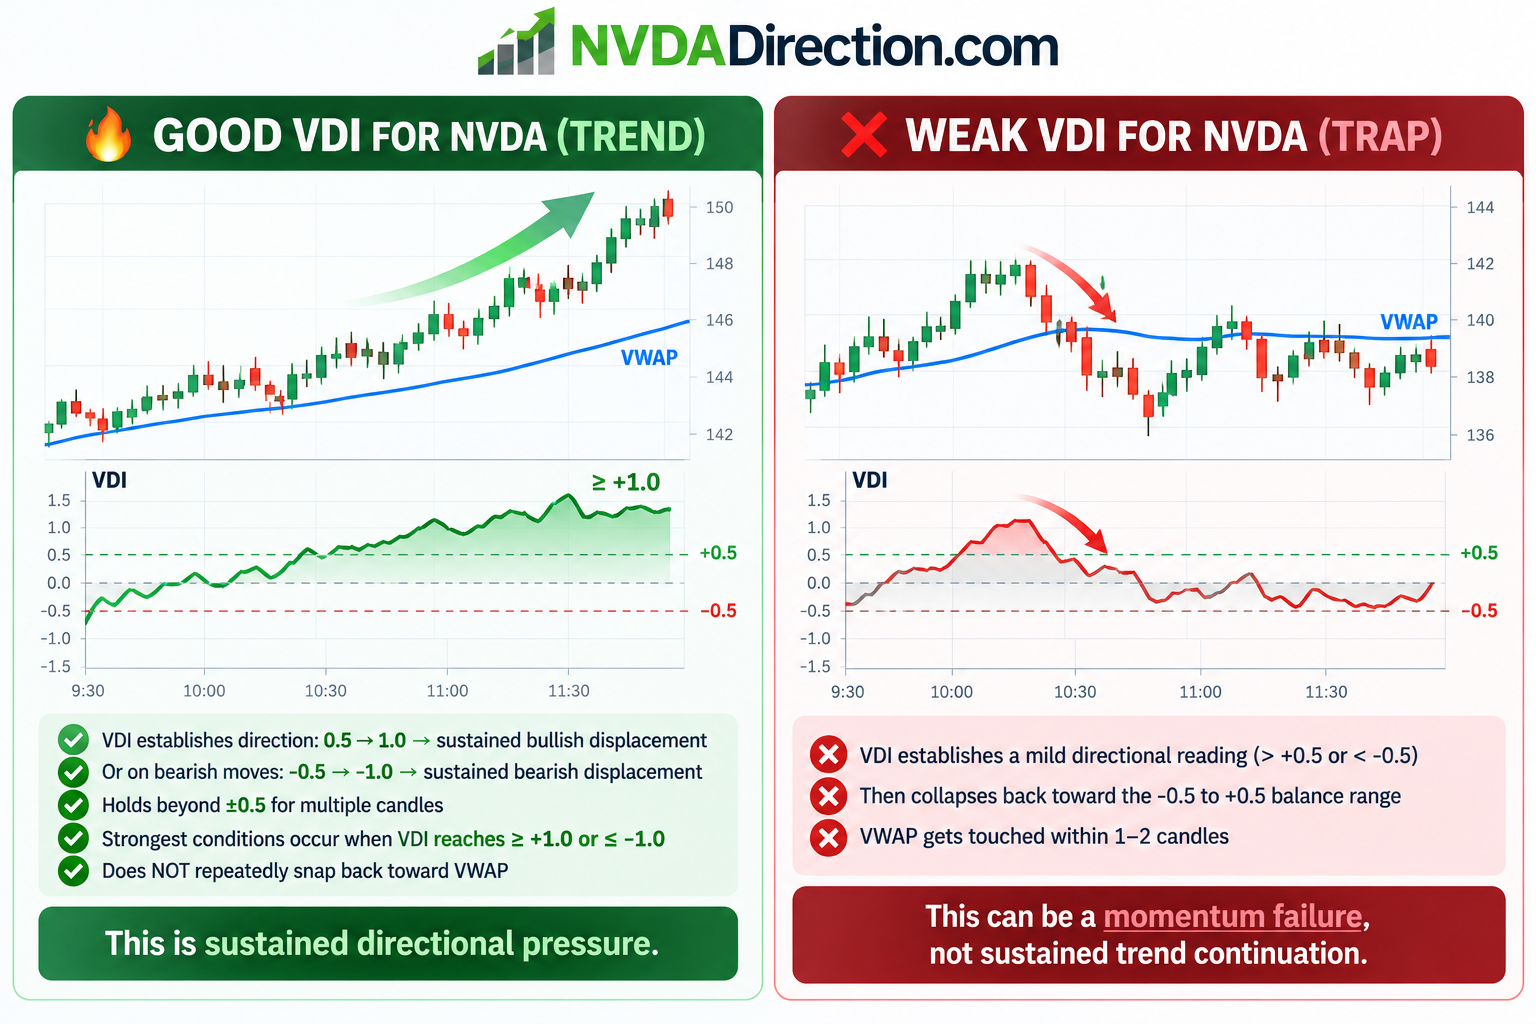
🔥 GOOD VDI FOR NVDA (TREND)
✅ Strong trend behavior
- VDI establishes direction:
0.5 → 1.0 → sustained bullish displacement - Or on bearish moves:
-0.5 → -1.0 → sustained bearish displacement - Holds beyond ±0.5 for multiple candles
- Strongest conditions occur when VDI reaches ≥ +1.0 or ≤ -1.0
- Does NOT repeatedly snap back toward VWAP
👉 This is sustained directional pressure
❌ WEAK VDI FOR NVDA (TRAP)
🚩 Mean-reversion trap
- VDI establishes a mild directional reading (> +0.5 or < -0.5)
- Then collapses back toward the -0.5 to +0.5 balance range
- VWAP gets touched within 1–2 candles
👉 This can be a momentum failure, not sustained trend continuation
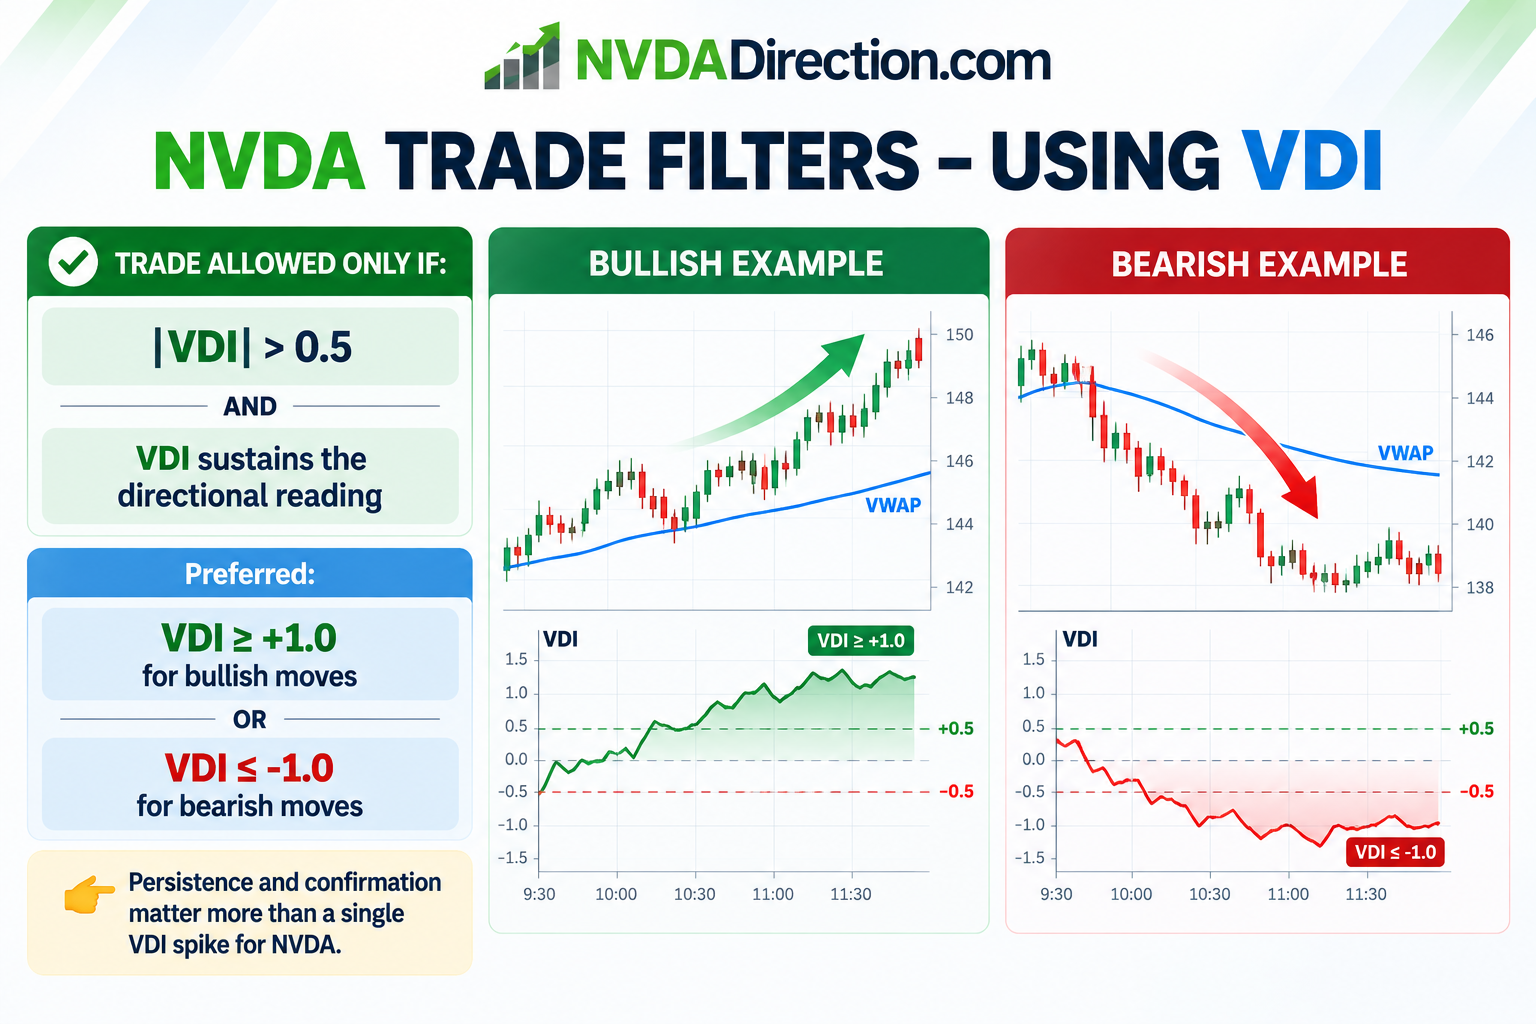
🛡️ NVDA TRADE FILTERS - USING VDI
✅ TRADE ALLOWED ONLY IF:
|VDI| > 0.5
AND
VDI sustains the directional reading
Preferred:
VDI ≥ +1.0 for bullish moves
OR
VDI ≤ -1.0 for bearish moves
👉 Persistence and confirmation matter more than a single VDI spike for NVDA.
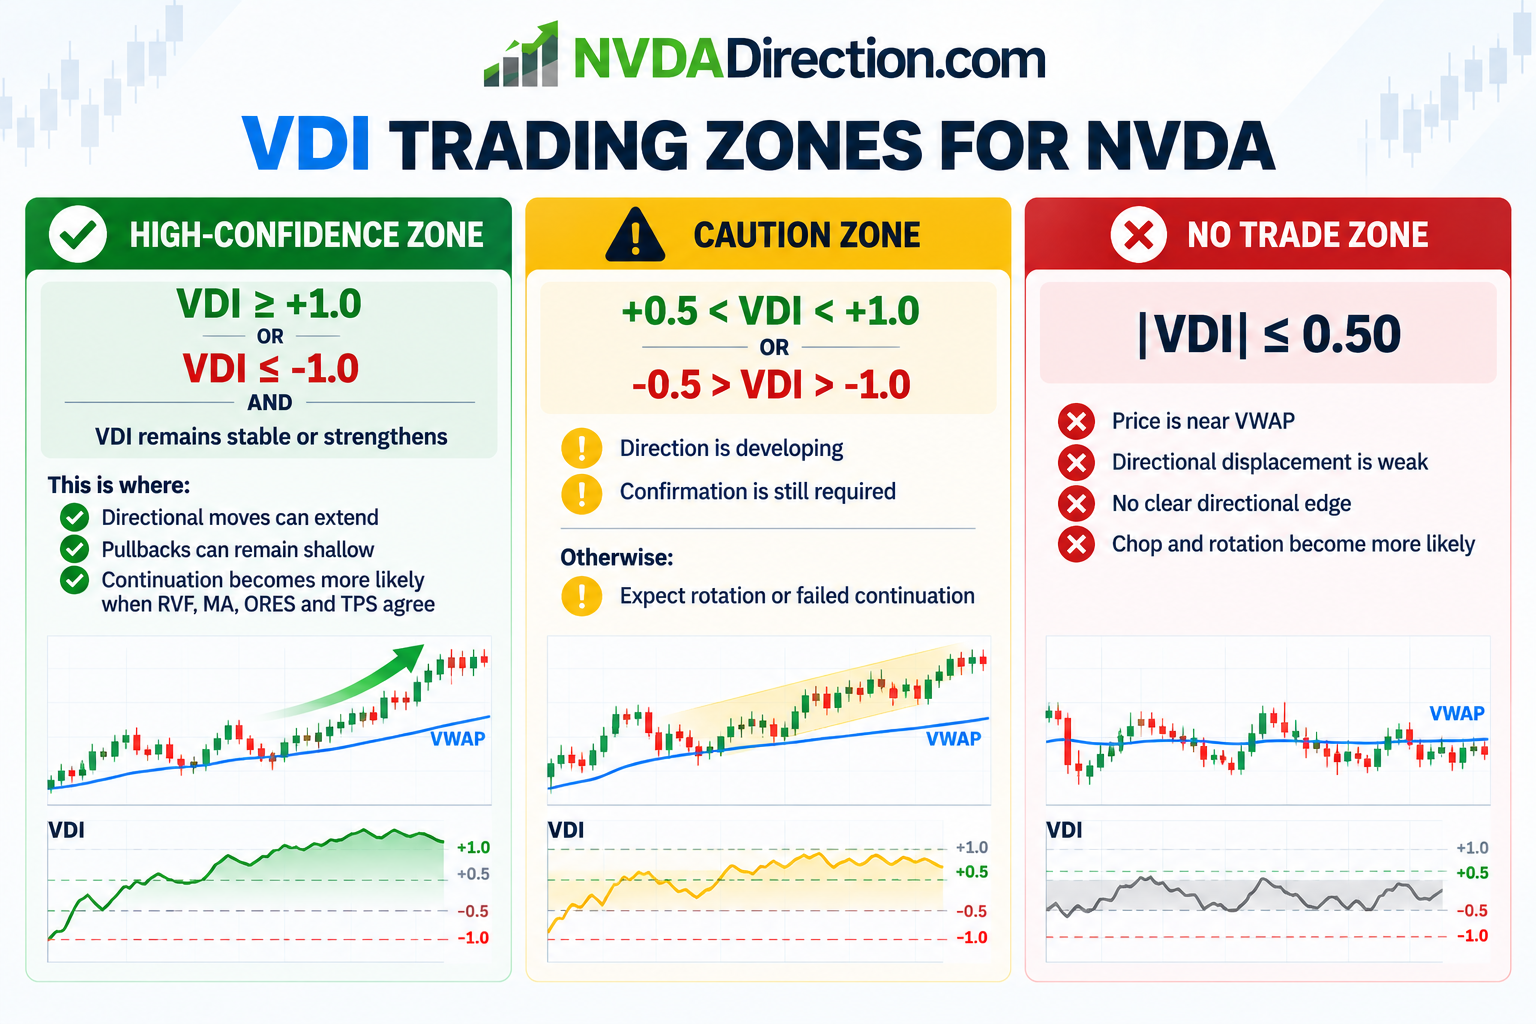
🔥 HIGH-CONFIDENCE ZONE:
VDI ≥ +1.0
OR
VDI ≤ -1.0
AND
VDI remains stable or strengthens
This is where:
- Directional moves can extend
- Pullbacks can remain shallow
- Continuation becomes more likely when RVF, MA, ORES and TPS agree
⚠️ CAUTION ZONE:
VDI between +0.5 and +1.0
OR
VDI between -0.5 and -1.0
→ Direction is developing
→ Confirmation is still required
Otherwise:
→ Expect rotation or failed continuation
❌ NO TRADE ZONE:
|VDI| ≤ 0.50
- Price is near VWAP
- Directional displacement is weak
- No clear directional edge
- Chop and rotation become more likely
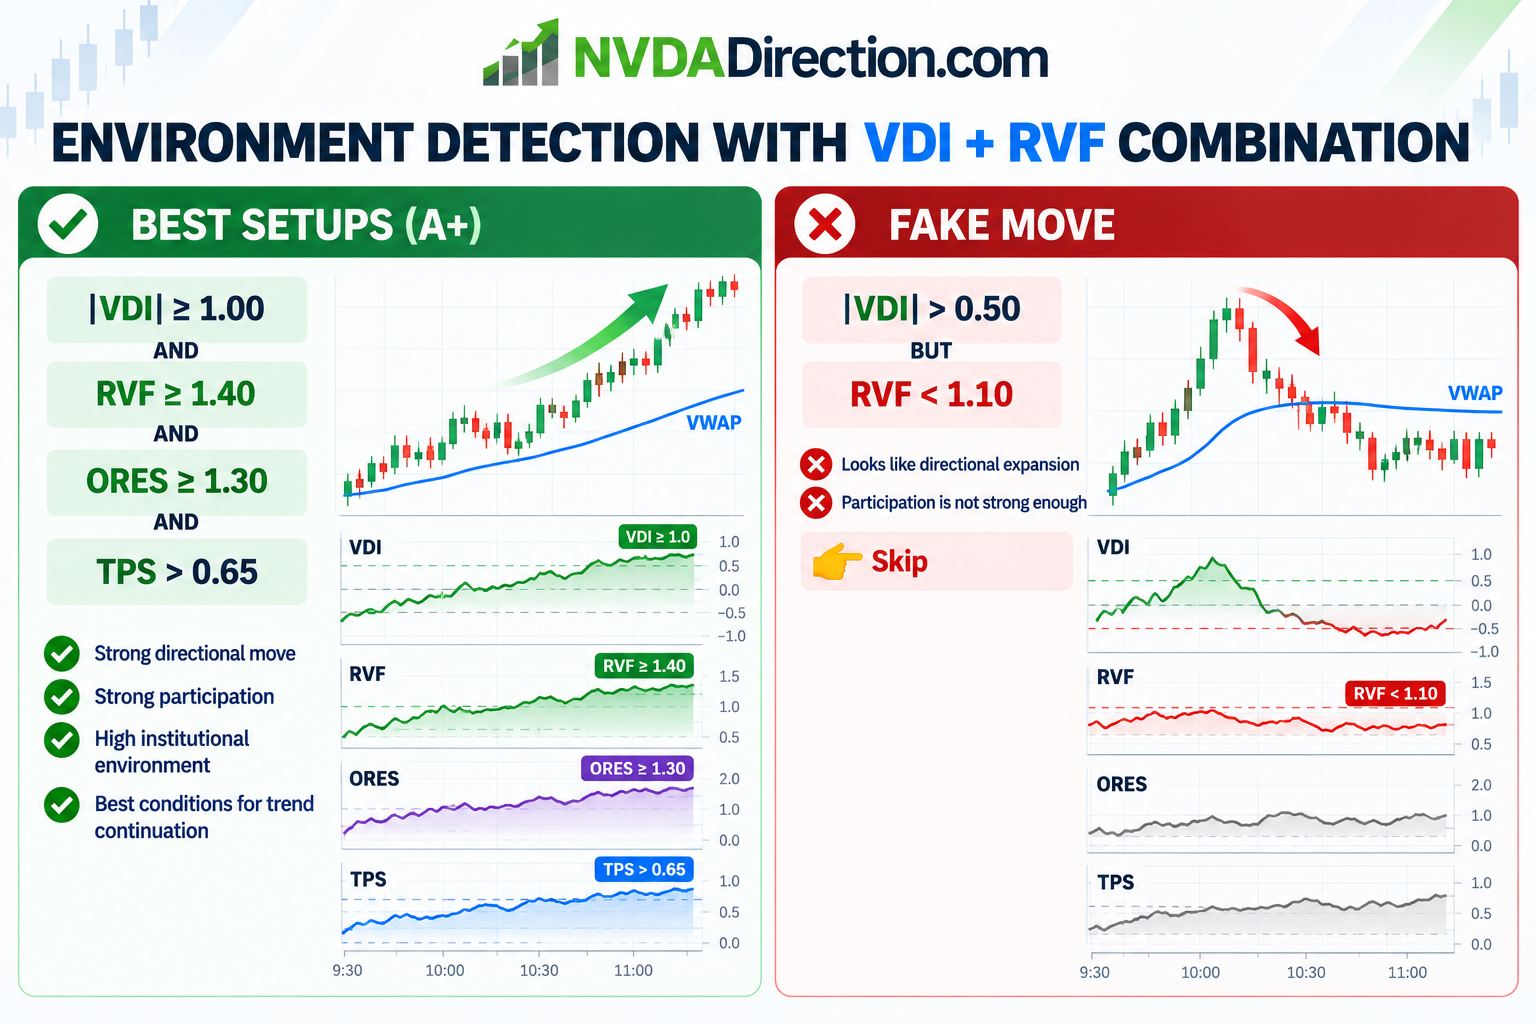
🔁 ENVIRONMENT DETECTION (TREND vs TRANSITION vs CHOP) WITH VDI + RVF COMBINATION (BIG EDGE FOR NVDA DIRECTION MEMBERS)
🔥 BEST SETUPS (A+)
|VDI| ≥ 1.00
AND
RVF ≥ 1.40
AND
ORES ≥ 1.30
AND
TPS > 0.65
→ Strong directional move
→ Strong participation
→ High institutional environment
→ Best conditions for trend continuation
❌ FAKE MOVE
|VDI| > 0.50
BUT
RVF < 1.10
→ Looks like directional expansion
→ Participation is not strong enough
👉 Skip
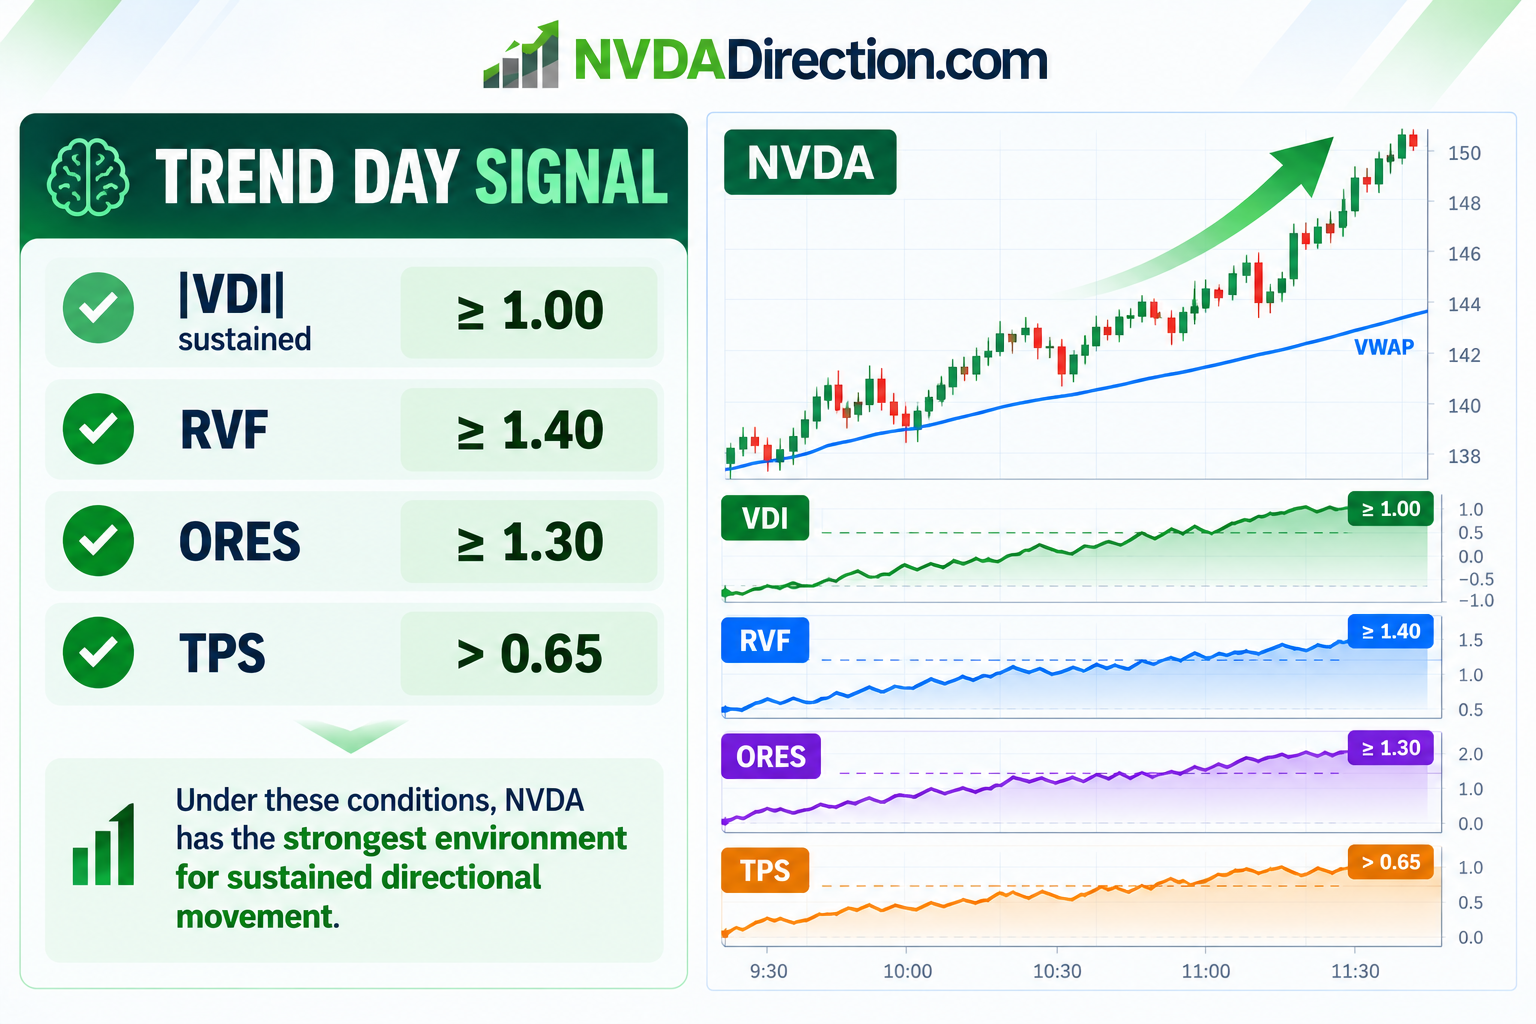
🧠 TREND DAY SIGNAL
|VDI| ≥ 1.00 sustained
AND
RVF ≥ 1.40
AND
ORES ≥ 1.30
AND
TPS > 0.65
→ Under these conditions, NVDA has the strongest environment for sustained directional movement.
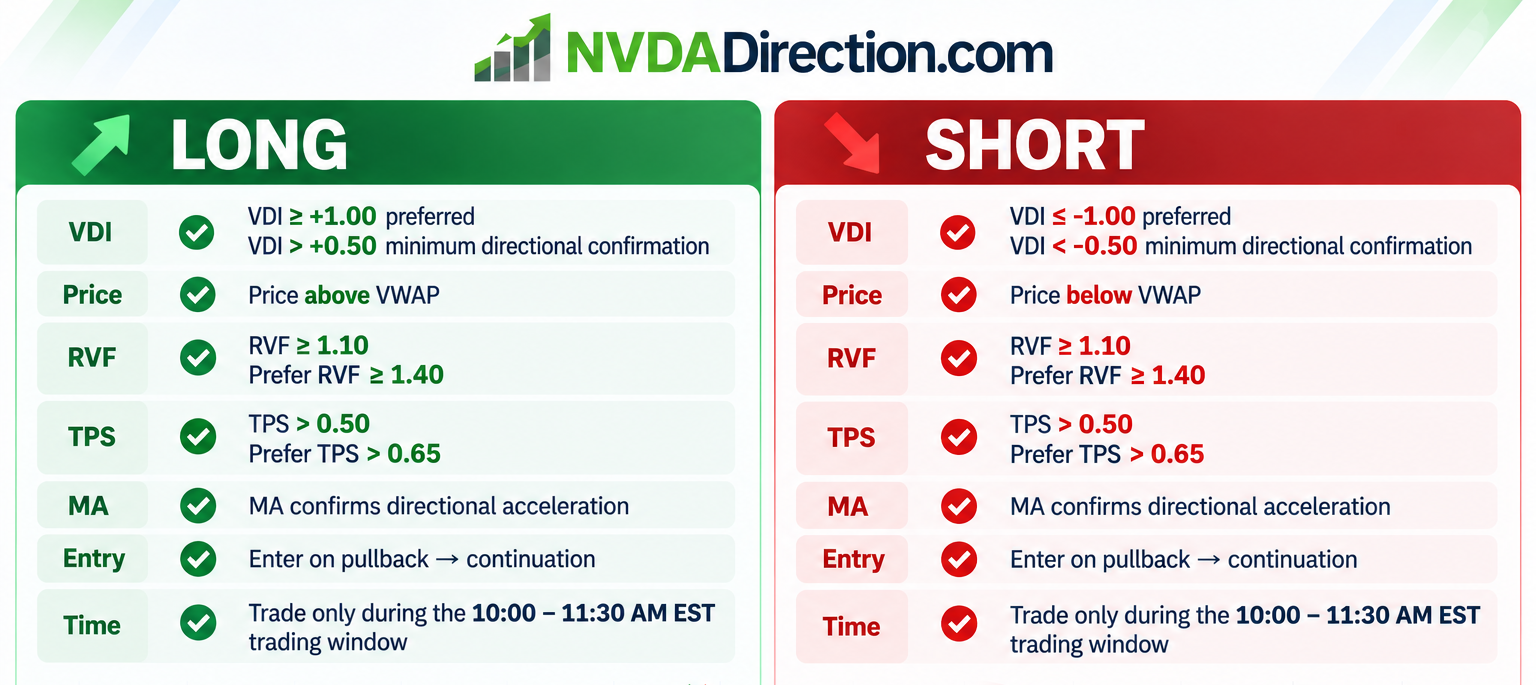
⚡ EXECUTION RULES (BUY / SELL SIGNALS)
LONG
- VDI ≥ +1.00 preferred
- VDI > +0.50 minimum directional confirmation
- Price above VWAP
- RVF ≥ 1.10
- Prefer RVF ≥ 1.40
- TPS > 0.50
- Prefer TPS > 0.65
- MA confirms directional acceleration
- Enter on pullback → continuation
- Trade only during the 10:00–11:30 AM EST trading window
SHORT
- VDI ≤ -1.00 preferred
- VDI < -0.50 minimum directional confirmation
- Price below VWAP
- RVF ≥ 1.10
- Prefer RVF ≥ 1.40
- TPS > 0.50
- Prefer TPS > 0.65
- MA confirms directional acceleration
- Enter on pullback → continuation
- Trade only during the 10:00–11:30 AM EST trading window
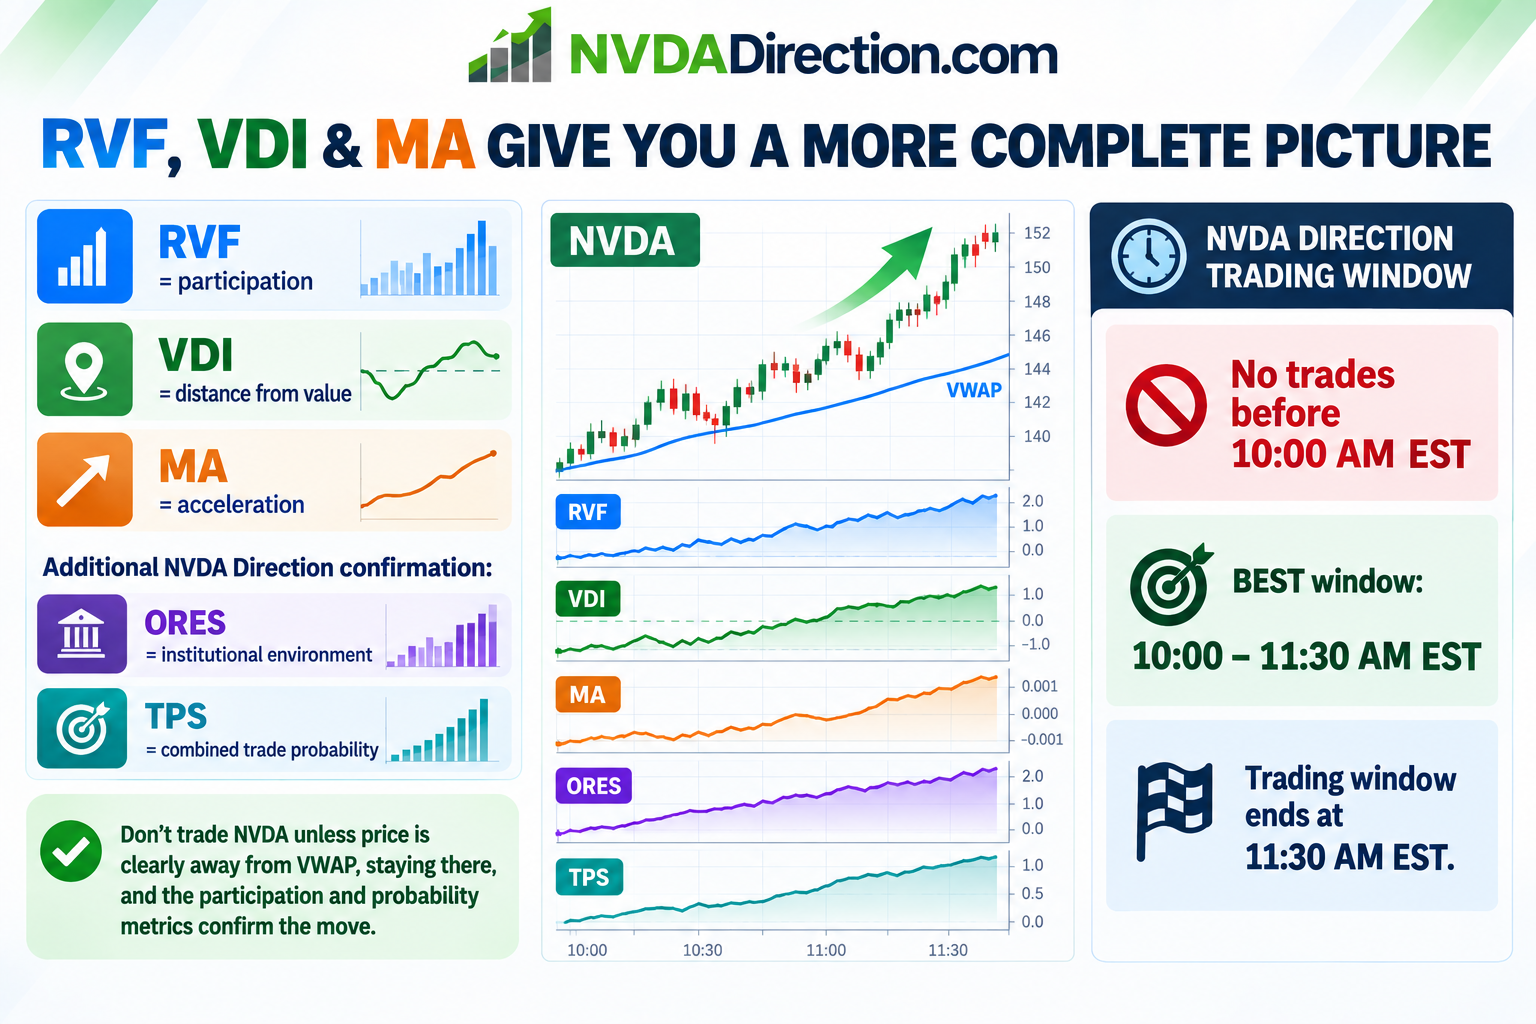
🧠 RVF, VDI & MA GIVE YOU A MORE COMPLETE PICTURE
Additional NVDA Direction confirmation:
- ORES = institutional environment
- TPS = combined trade probability
Don’t trade NVDA unless price is clearly away from VWAP, staying there, and the participation and probability metrics confirm the move.
⏱️ NVDA Direction Trading Window
No trades before 10:00 AM EST
BEST window: 10:00–11:30 AM EST
Trading window ends at 11:30 AM EST.