Introduction to NVDA Probability Parameters - RVF, VDI, MA, ORES & the Combined TPS
Contact customer support at support@nvdadirection.com
NVDA Probability Parameters
NVDA Direction monitors NVDA’s market direction, analyzes underlying conviction and acceleration, and helps members execute trades with greater precision using the tools available on the member dashboard.
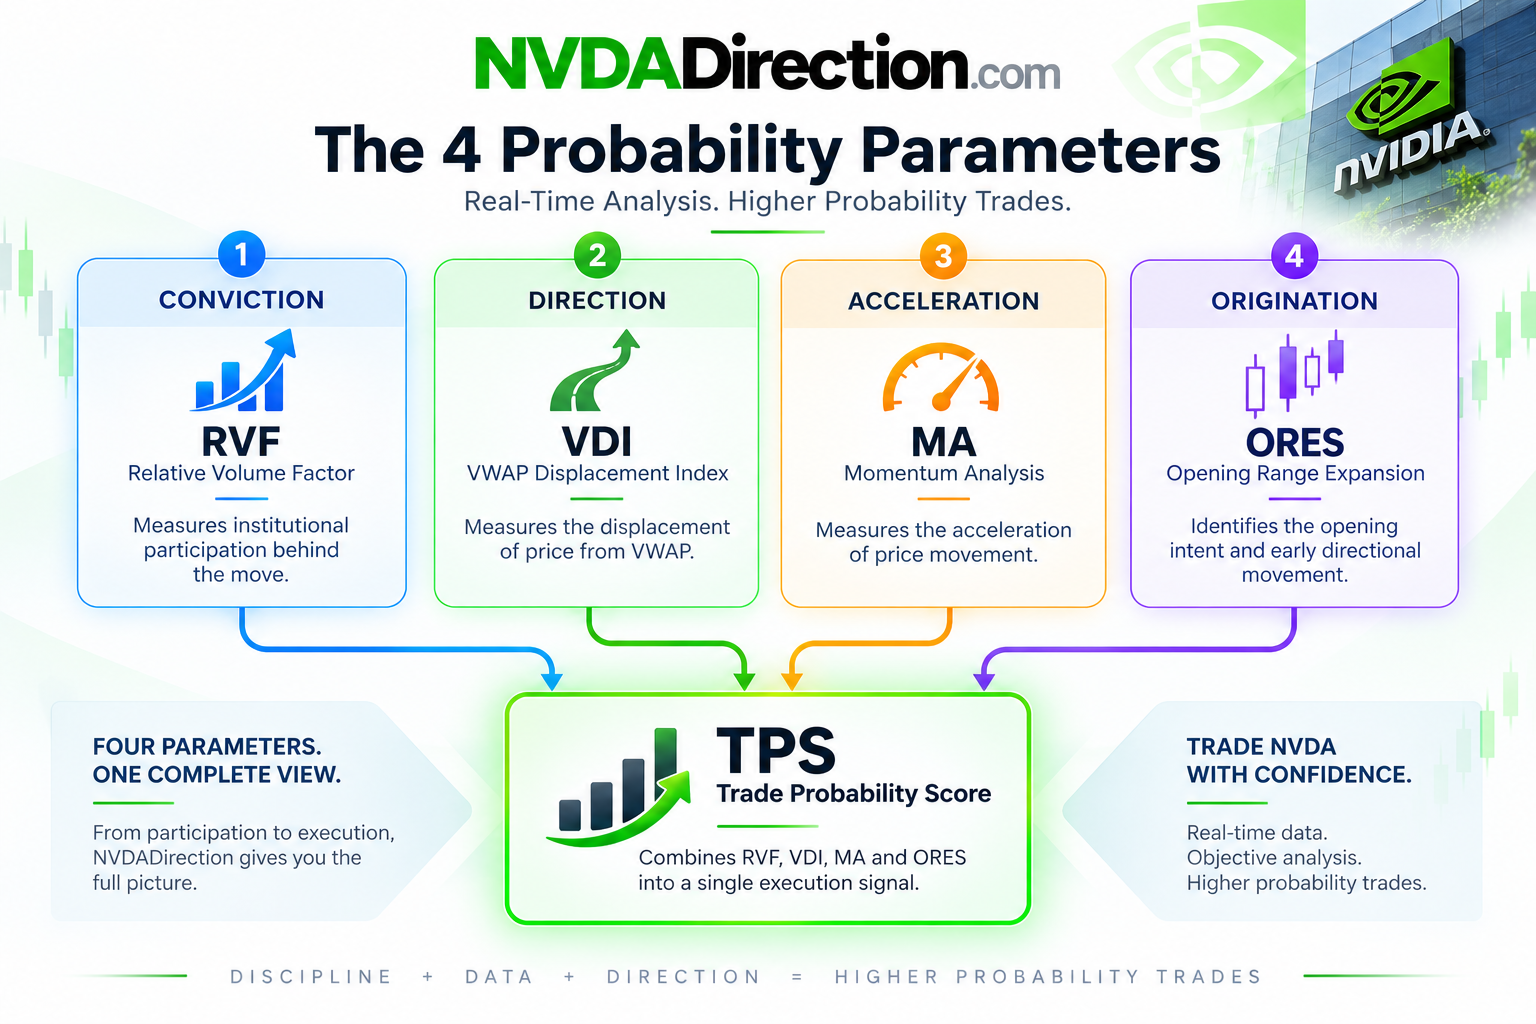
At the core of the NVDADirection methodology are four probability parameters and their aggregated score. Each parameter is calculated in real time during regular trading hours, 9:30 AM to 4:00 PM EST on trading days.
These parameters are designed specifically to help traders understand whether an NVDA move has genuine underlying participation, directional conviction, acceleration, and a meaningful origin.
- RVF → institutional participation
- VDI → displacement from VWAP
- MA → price acceleration
- ORES → opening intent
- TPS → Trade Probability Score → execution signal (combines all of the above)
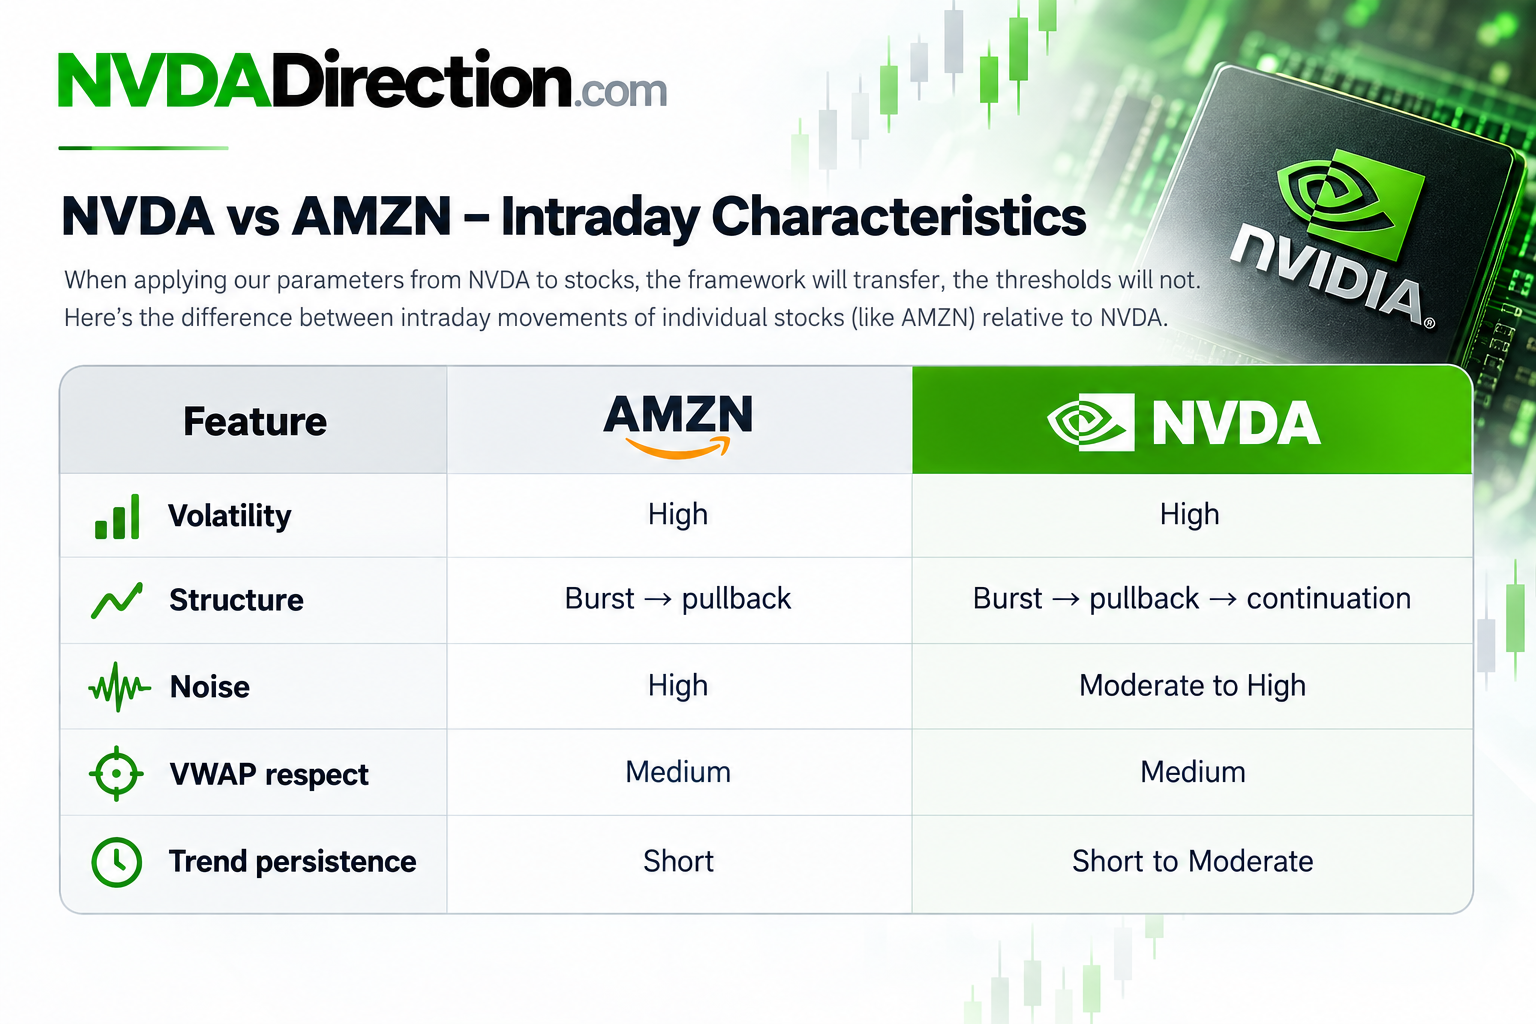
When applying our parameters from NVDA to stocks, the framework will transfer, the thresholds will not. Here’s the difference between intraday movements of individual stocks (like AMZN) relative to the NVDA.
|
Feature |
AMZN |
NVDA |
|
Volatility |
High |
High |
|
Structure |
Burst → pullback |
Burst → pullback → continuation |
|
Noise |
High |
Moderate to High |
|
VWAP respect |
Medium |
Medium |
|
Trend persistence |
Short |
Short to Moderate |
⚠️ What must change (critical)
NVDA moves:
- Faster
- More volatile
- With greater potential for extreme displacement
- With more pronounced momentum bursts
So your thresholds must be calibrated specifically for NVDA.
For NVDA, volume can expand rapidly around directional moves, earnings-related activity, market catalysts, and periods of strong institutional participation, so the thresholds must account for NVDA's higher and more variable intraday volume. In other words, thresholds will be different when using our algorithm for individual stocks. Compared to broader market instruments, NVDA can experience larger price displacements, faster acceleration, and more significant volume spikes. A move from 1.00 → 1.12 RVF may be meaningful in a broad-market instrument but may represent a relatively normal increase during an active NVDA session. NVDA does not necessarily need an extreme RVF spike — it needs consistent and increasing RVF that is supported by directional price movement.
Understanding these principles helps NVDADirection members to turn numbers on our dashboard into actionable trades and avoid traps. Our parameters help you identify sustained imbalance + institutional participation. NVDADirection members do not trade any individual parameter in isolation. They trade regimes created by combinations of scores around key institutional levels.
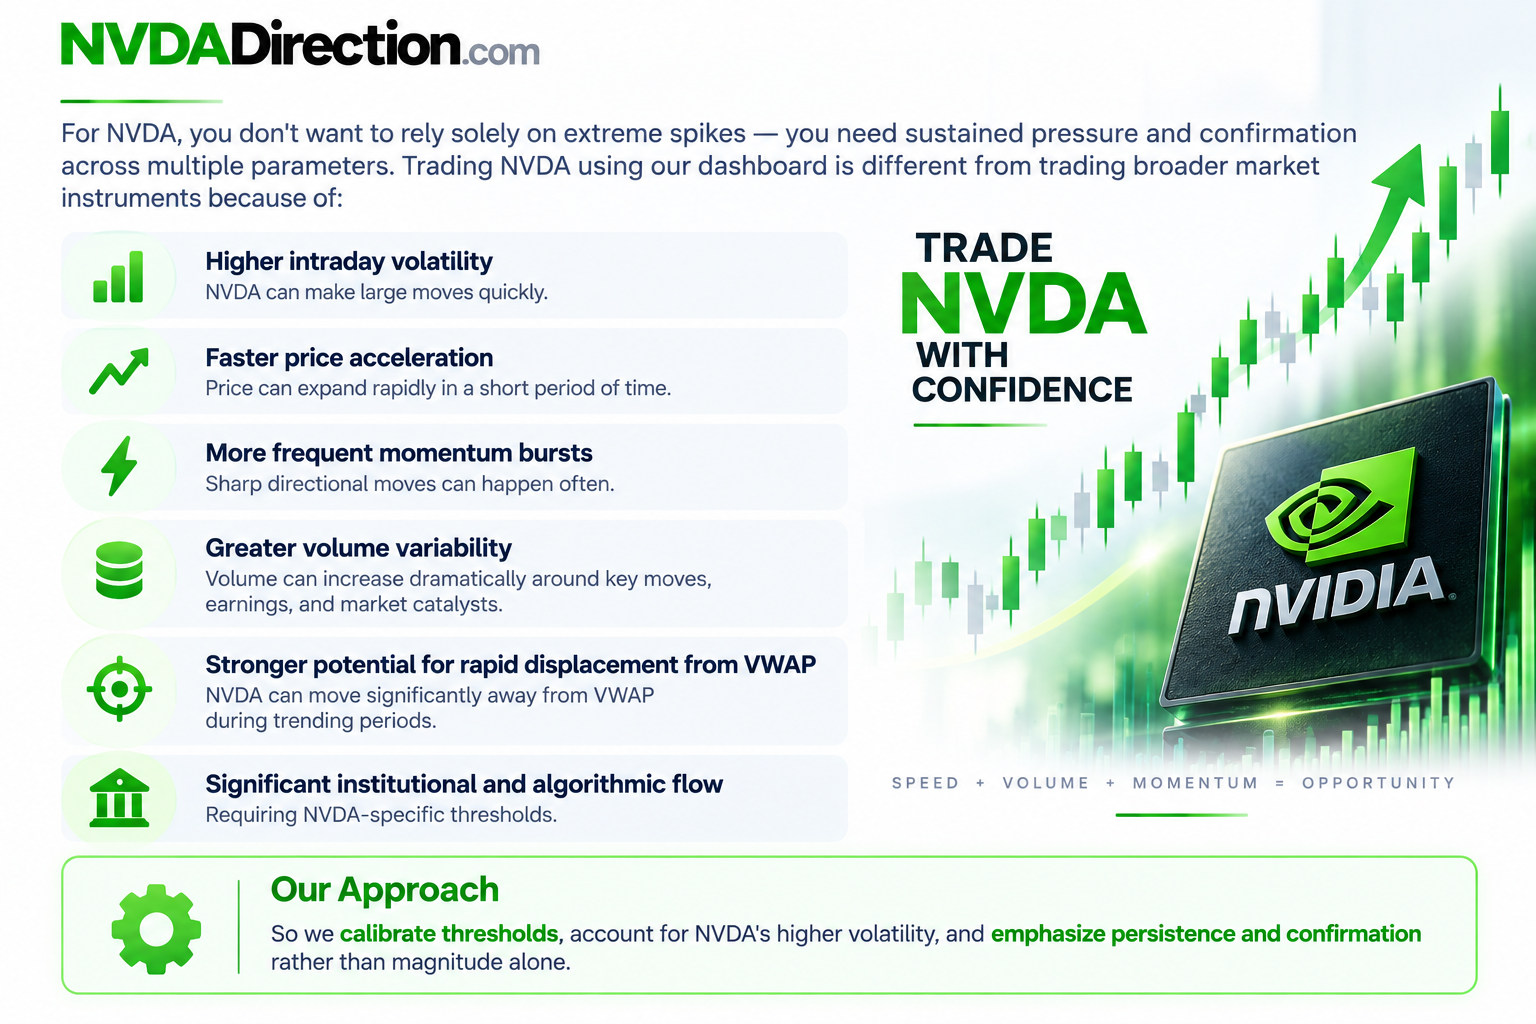
For NVDA, you don't want to rely solely on extreme spikes — you need sustained pressure and confirmation across multiple parameters. Trading NVDA using our dashboard is different from trading broader market instruments because of:
- Higher intraday volatility
- Faster price acceleration
- More frequent momentum bursts
- Greater volume variability
- Stronger potential for rapid displacement from VWAP
- Significant institutional and algorithmic flow → requiring NVDA-specific thresholds
So we calibrate thresholds, account for NVDA's higher volatility, and emphasize persistence and confirmation rather than magnitude alone.