Supply and Demand Zone Strength: How to Read Retests
Contact customer support at support@nvdadirection.com
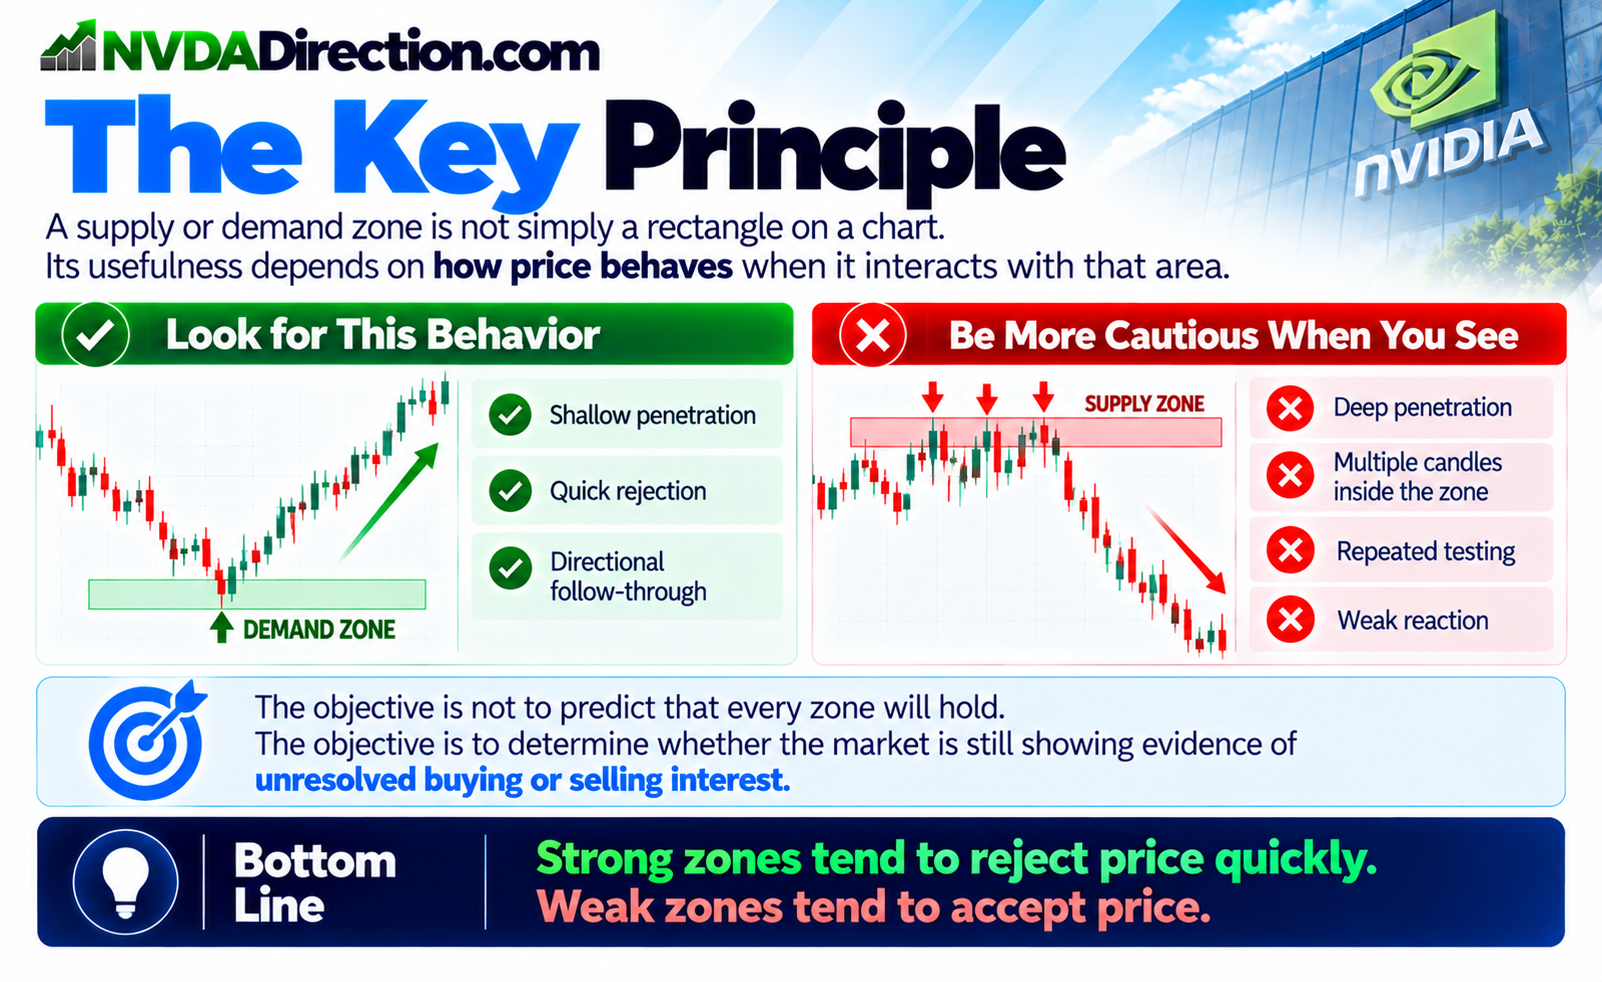
Supply and demand zones can help traders identify areas where significant buying or selling interest previously entered the market. However, not every zone has the same strength.
A zone may look impressive on a chart, but its real usefulness often becomes clearer when price returns to test the zone.
For NVDA traders, understanding how price interacts with a zone can help distinguish between a level that still has meaningful unfilled interest and one that has already been heavily consumed.
🧠 What Makes a Supply or Demand Zone Strong?
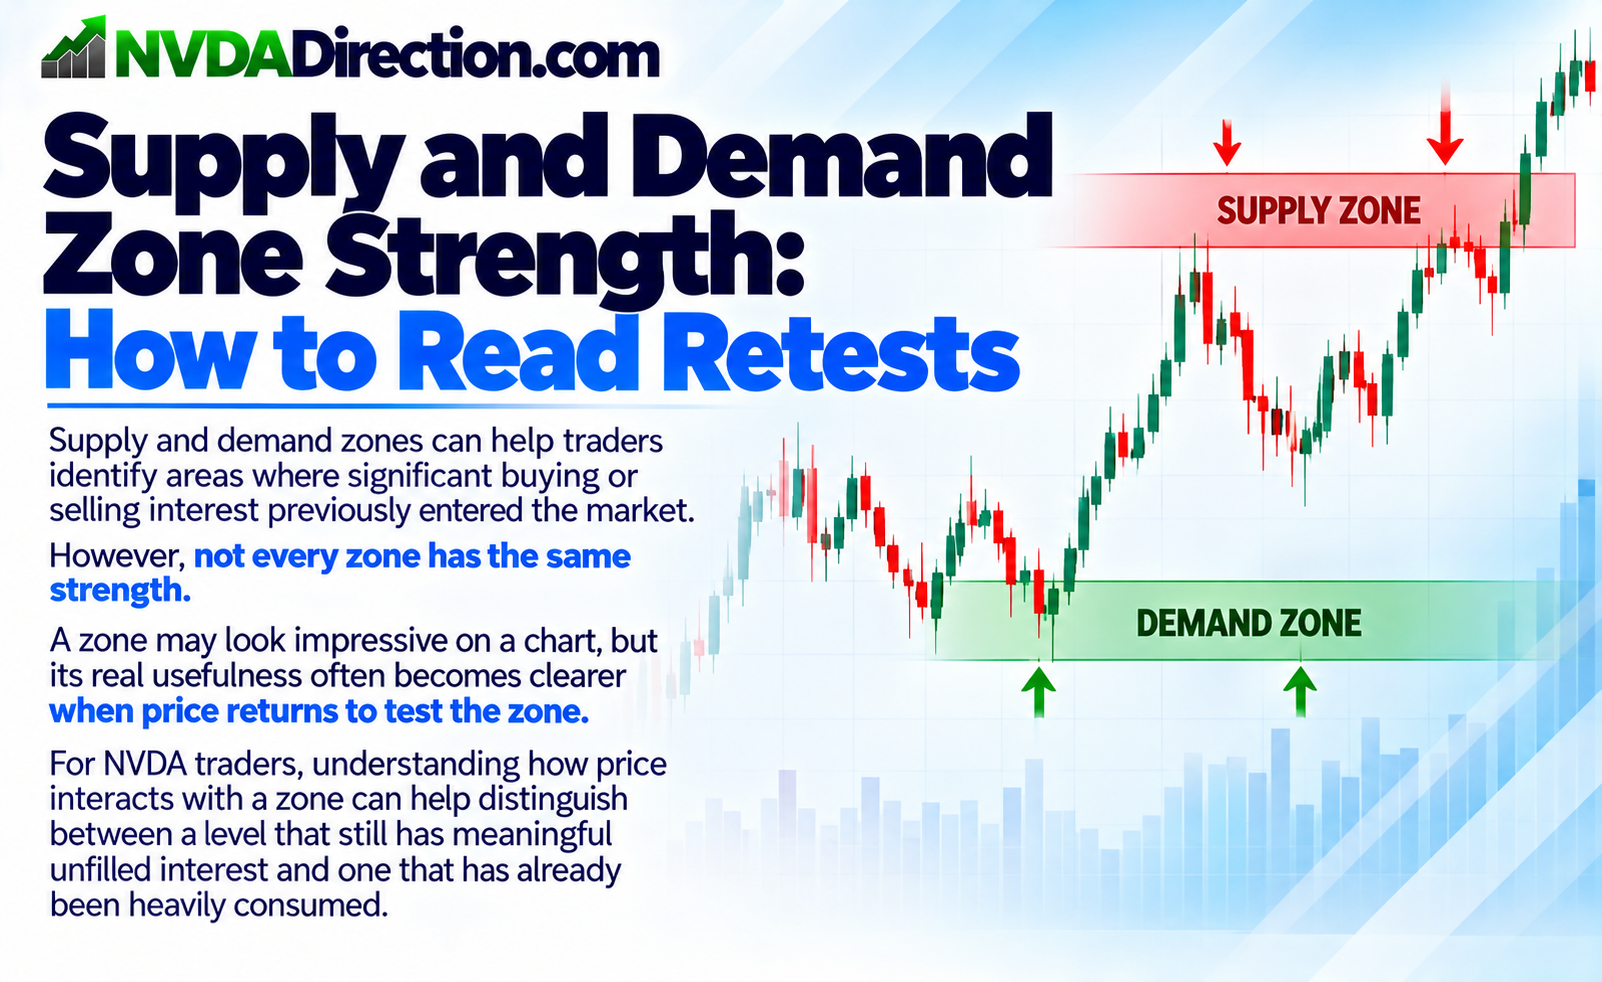
The strength of a zone can be evaluated by observing how price behaves when it revisits the area.
Two important factors are:
- How deeply price penetrates the zone
- How many candles spend time trading inside the zone
Generally, a stronger zone tends to produce a reaction with relatively little penetration.
A weaker zone tends to allow price to travel farther into the area and spend more time trading there.
This provides an important clue about what may be happening to the orders within the zone.
🔴 Supply Zone Retests
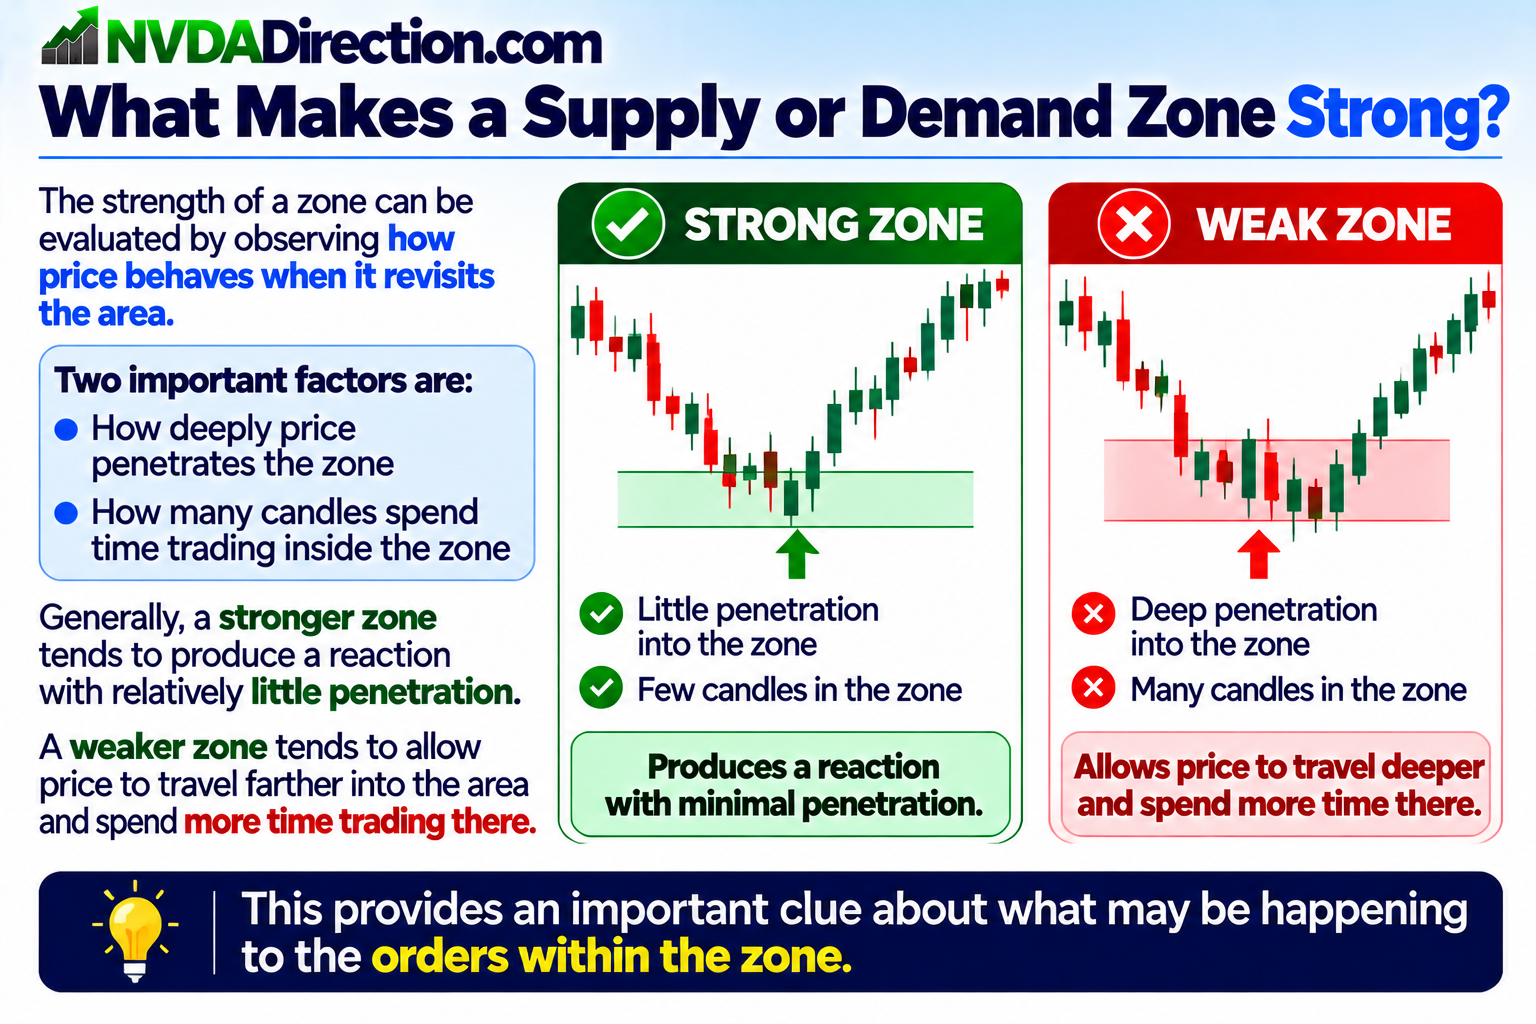
A supply zone represents an area where selling pressure previously overwhelmed buying pressure.
When NVDA rallies back into an existing supply zone, pay attention to the depth and speed of the retest.
💪 Strong Supply Zone
A strong supply zone may show:
- Price briefly enters the zone
- A wick tests the outer portion of the zone
- Price quickly rejects the area
- Candles close back below the zone
- Little time is spent trading inside the zone
This type of reaction suggests that meaningful selling interest may still be present.
⚠️ Weakening Supply Zone
A supply zone becomes less convincing when:
- Multiple candles trade inside it
- Price penetrates progressively deeper
- Candles repeatedly close within the zone
- Price repeatedly tests the same area
- Sellers fail to produce a decisive reaction
Repeated interaction can indicate that available sell orders are being consumed.
🟢 Demand Zone Retests
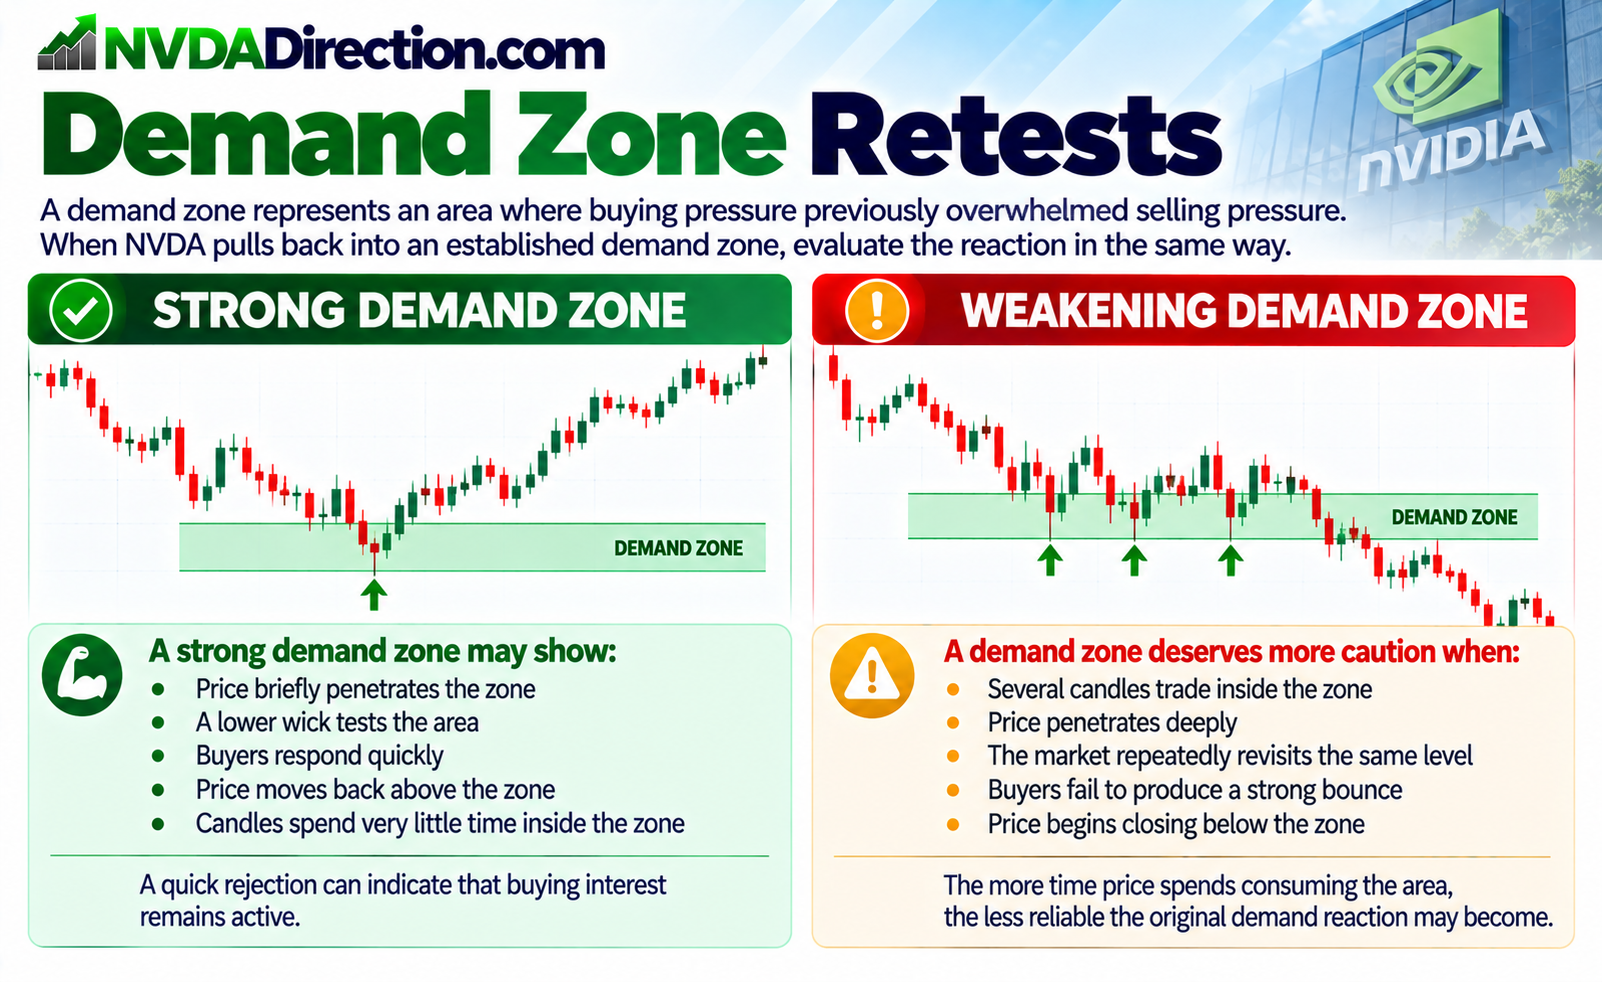
A demand zone represents an area where buying pressure previously overwhelmed selling pressure.
When NVDA pulls back into an established demand zone, evaluate the reaction in the same way.
💪 Strong Demand Zone
A strong demand zone may show:
- Price briefly penetrates the zone
- A lower wick tests the area
- Buyers respond quickly
- Price moves back above the zone
- Candles spend very little time inside the zone
A quick rejection can indicate that buying interest remains active.
⚠️ Weakening Demand Zone
A demand zone deserves more caution when:
- Several candles trade inside the zone
- Price penetrates deeply
- The market repeatedly revisits the same level
- Buyers fail to produce a strong bounce
- Price begins closing below the zone
The more time price spends consuming the area, the less reliable the original demand reaction may become.
📊 Zone Strength Is About the Retest
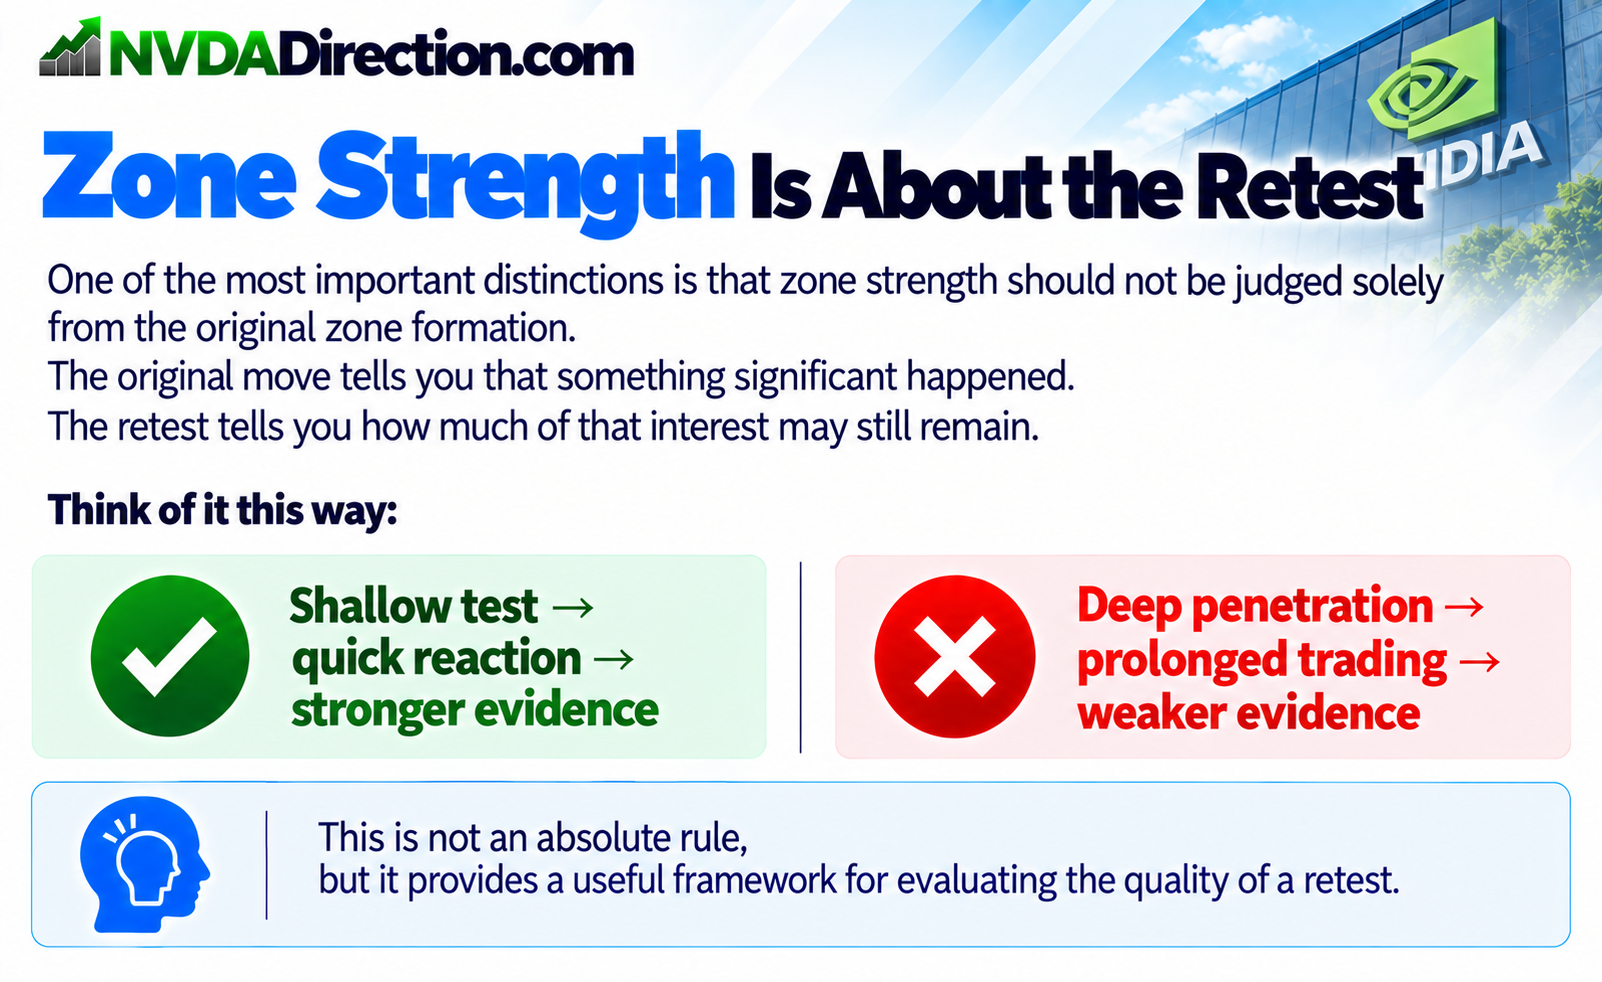
One of the most important distinctions is that zone strength should not be judged solely from the original zone formation.
The original move tells you that something significant happened.
The retest tells you how much of that interest may still remain.
Think of it this way:
Shallow test → quick reaction → stronger evidence
Deep penetration → prolonged trading → weaker evidence
This is not an absolute rule, but it provides a useful framework for evaluating the quality of a retest.
🔎 Wick vs. Candle Body
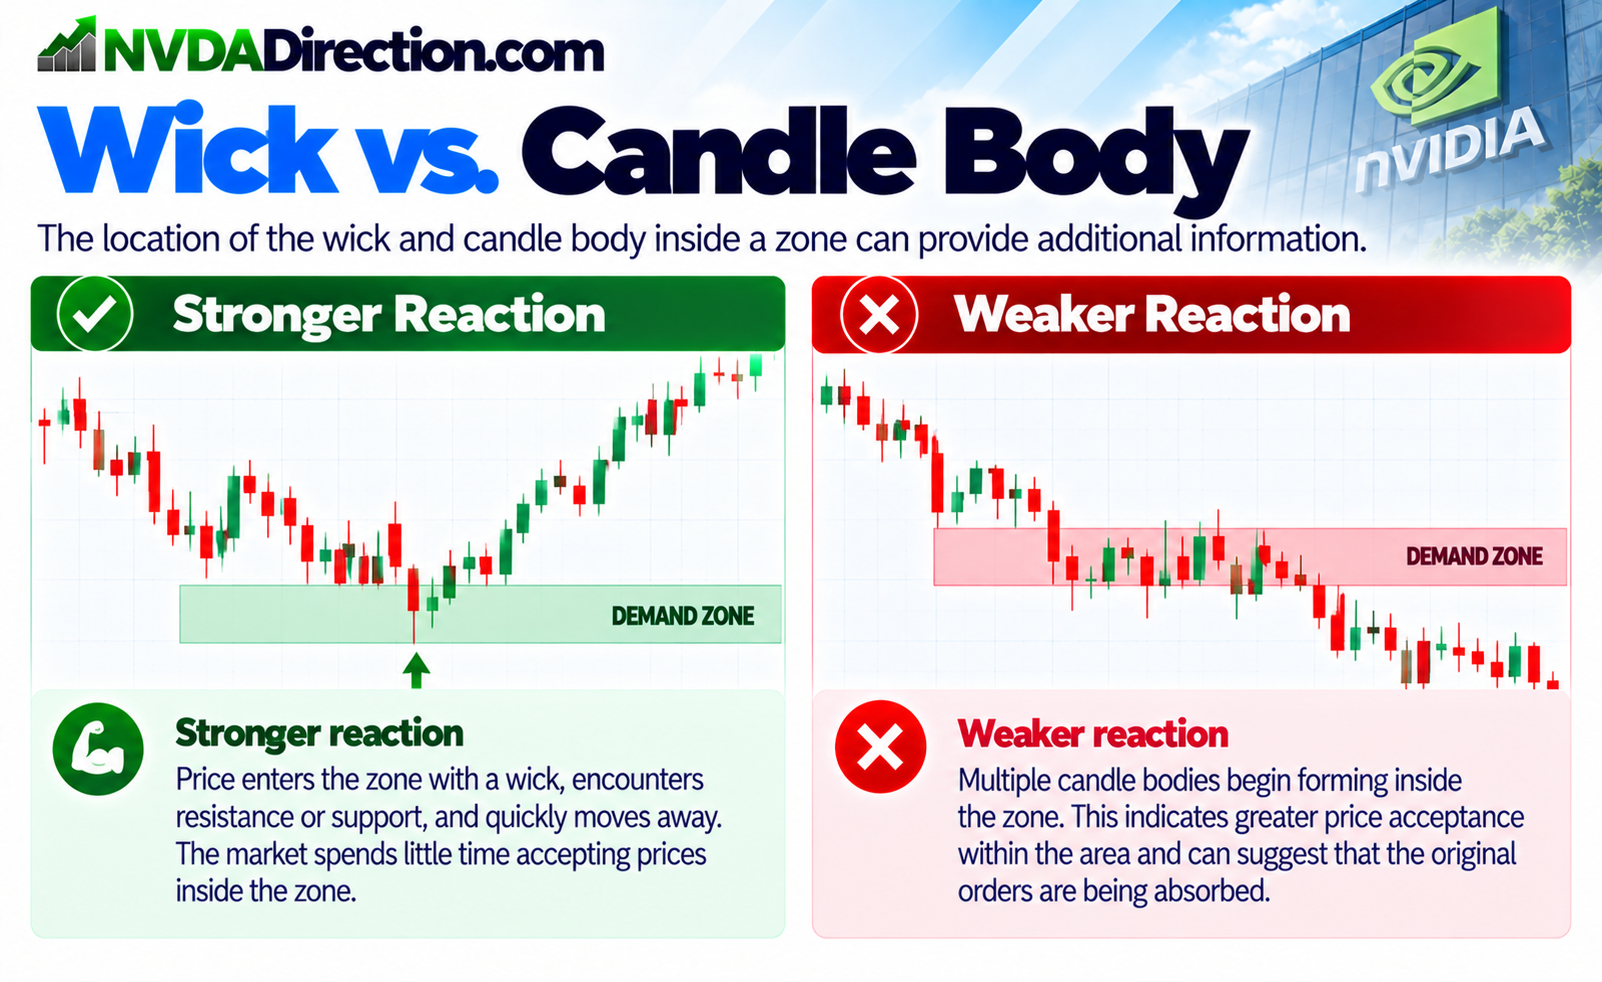
The location of the wick and candle body inside a zone can provide additional information.
Stronger reaction
Price enters the zone with a wick, encounters resistance or support, and quickly moves away.
The market spends little time accepting prices inside the zone.
Weaker reaction
Multiple candle bodies begin forming inside the zone.
This indicates greater price acceptance within the area and can suggest that the original orders are being absorbed.
🔥 Why Multiple Tests Matter
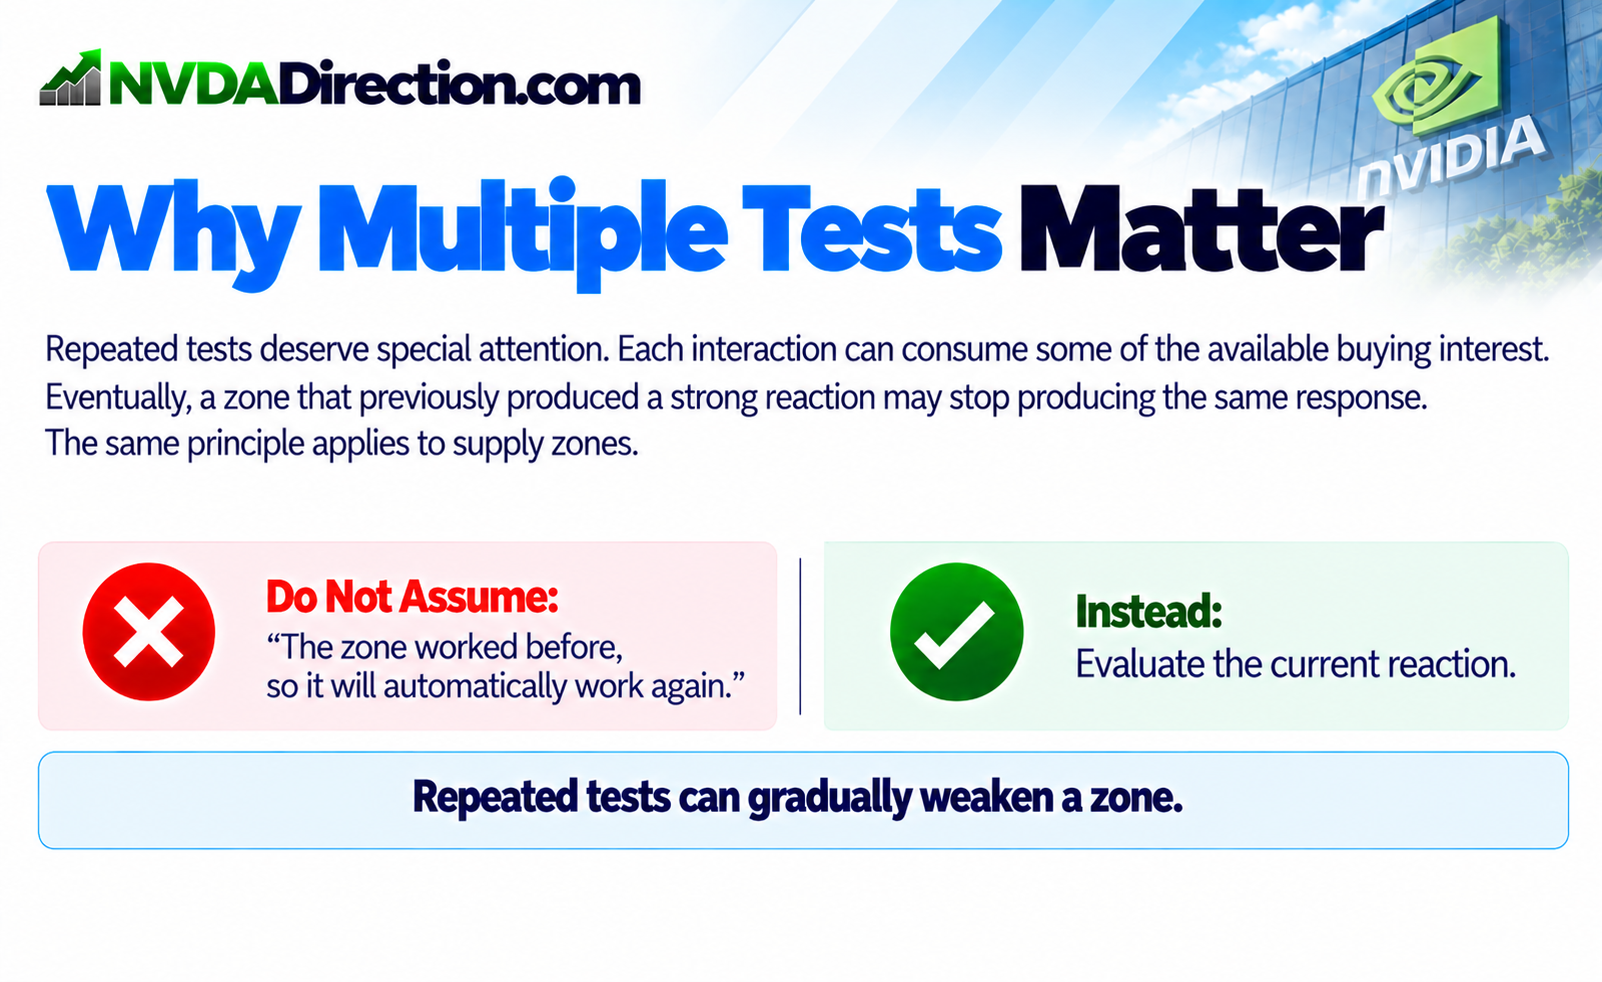
Repeated tests deserve special attention.
Suppose NVDA reaches a demand zone for the first time and immediately rallies.
Later, NVDA returns to the same area.
Then it returns again.
Each interaction can consume some of the available buying interest.
Eventually, a zone that previously produced a strong reaction may stop producing the same response.
The same principle applies to supply zones.
Repeated tests can gradually weaken a zone.
Therefore, traders should not assume:
"The zone worked before, so it will automatically work again."
Instead, evaluate the current reaction.
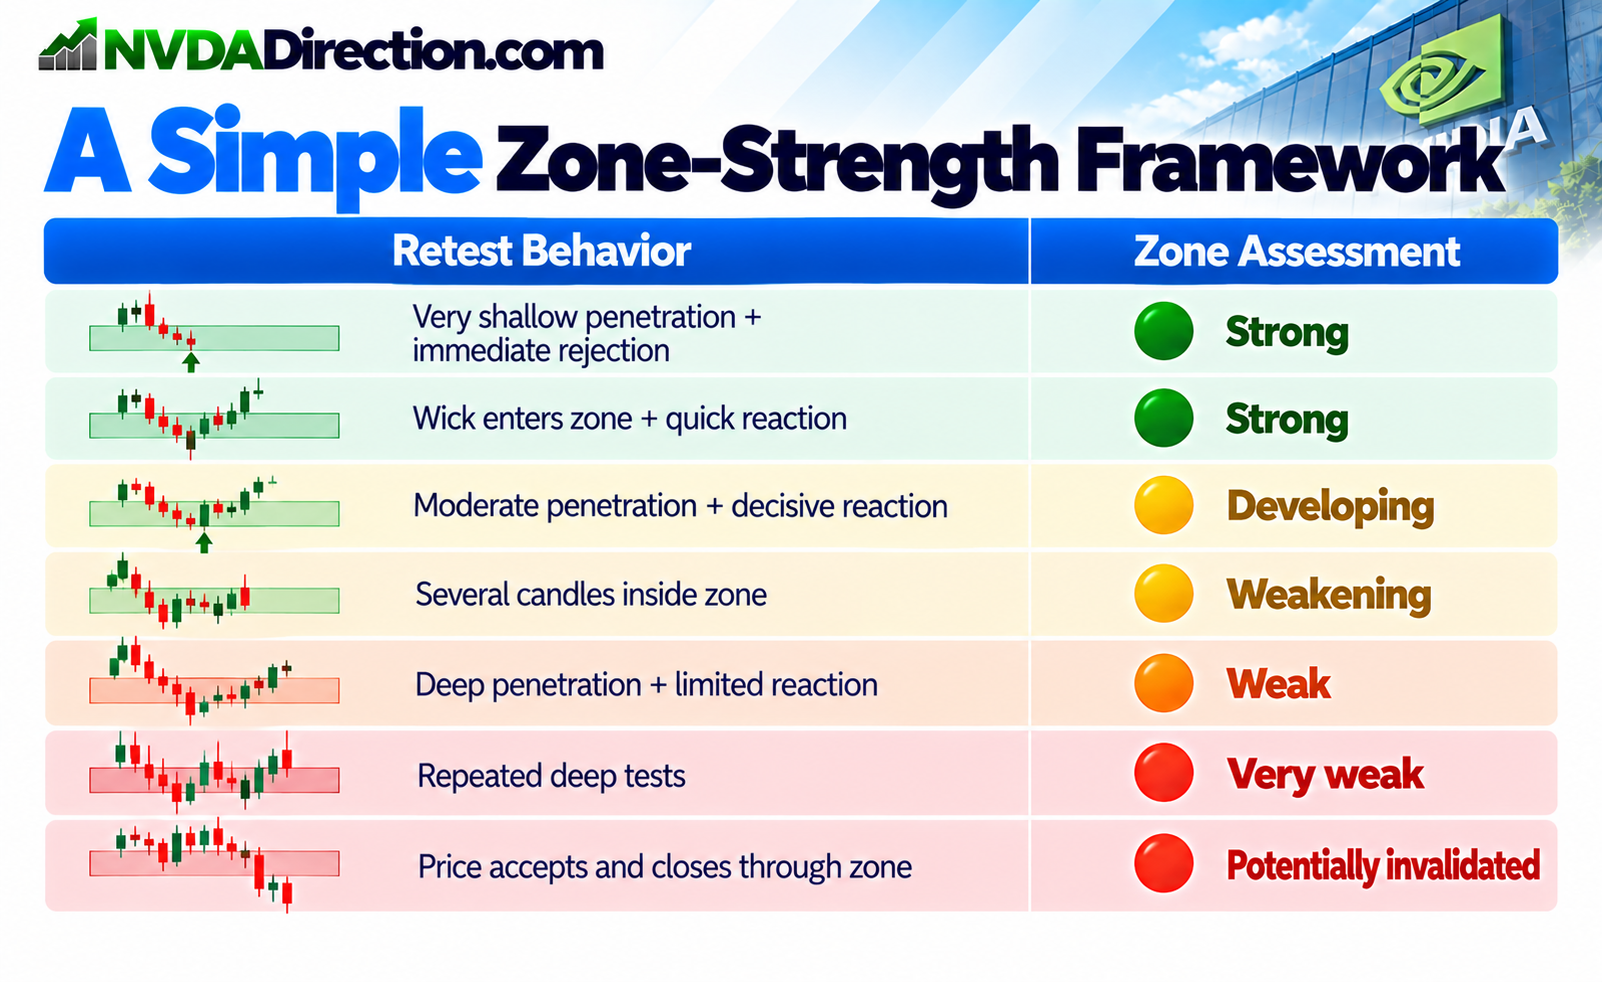
🧠 A Simple Zone-Strength Framework
|
|
|
|
|
|
|
|
|
|
|
|
|
|
|
|
|
|
|
|
|
|
|
|
⚡ Supply/Demand + NVDA Direction
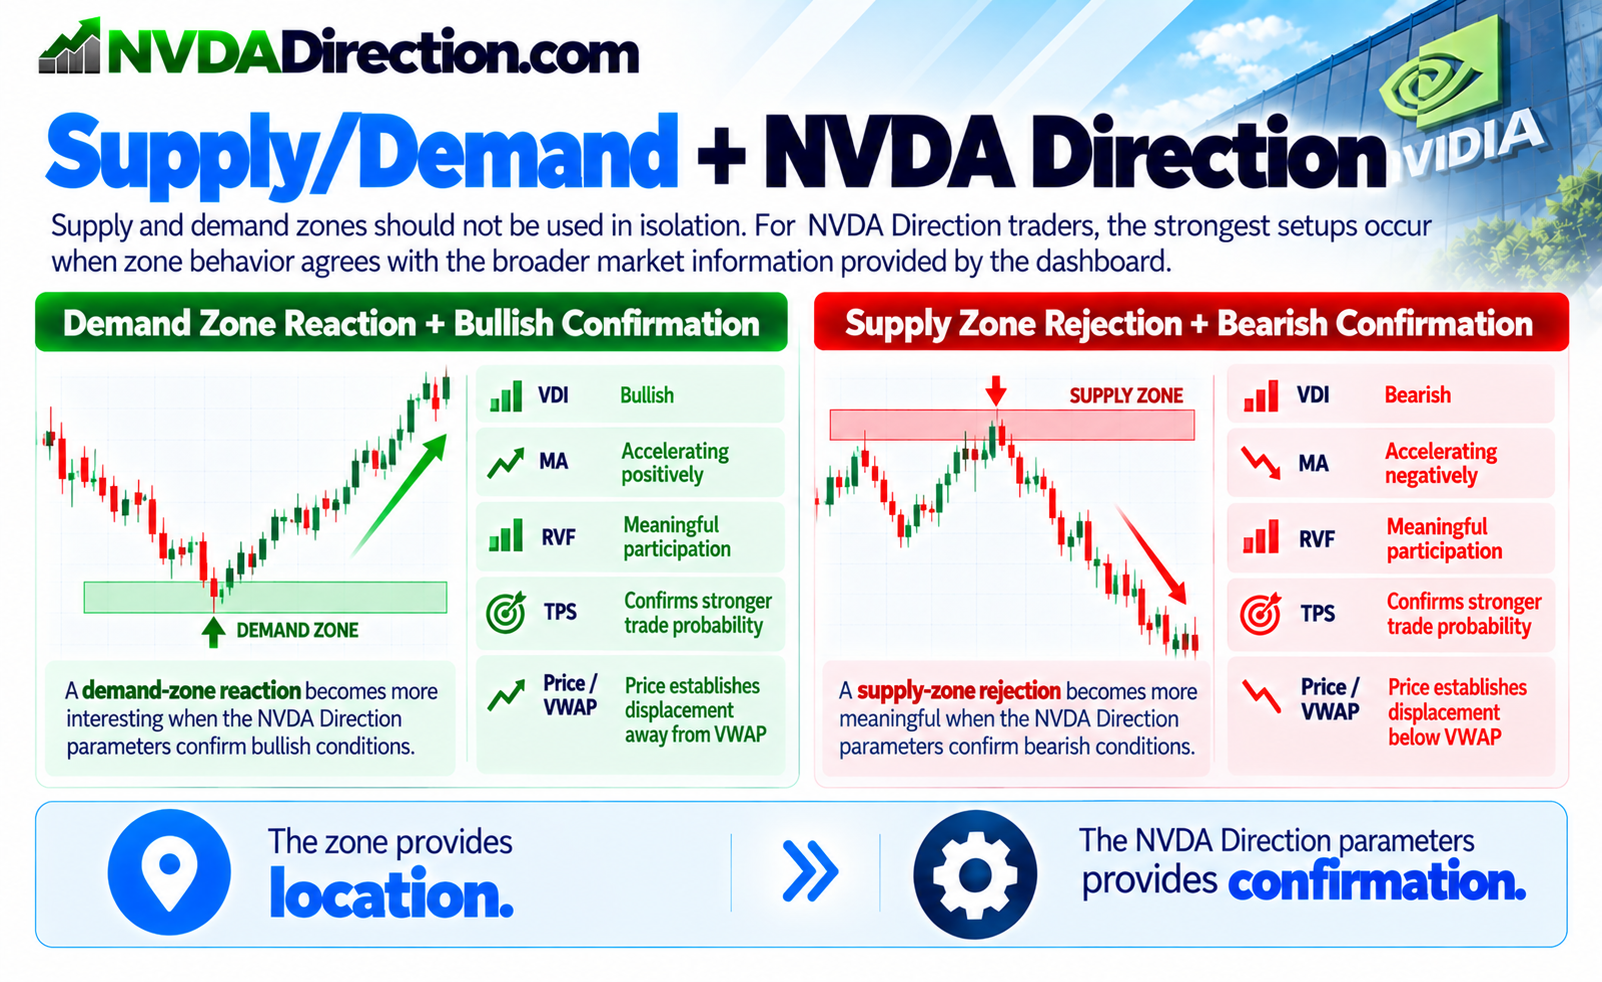
Supply and demand zones should not be used in isolation.
For NVDA Direction traders, the strongest setups occur when zone behavior agrees with the broader market information provided by the dashboard.
For example, a demand-zone reaction becomes more interesting when:
- VDI is bullish
- MA is accelerating positively
- RVF shows meaningful participation
- TPS confirms stronger trade probability
- Price begins establishing displacement away from VWAP
Likewise, a supply-zone rejection becomes more meaningful when the directional parameters confirm bearish conditions.
The zone provides location.
The NVDA Direction parameters provide confirmation.
🎯 The Key Principle
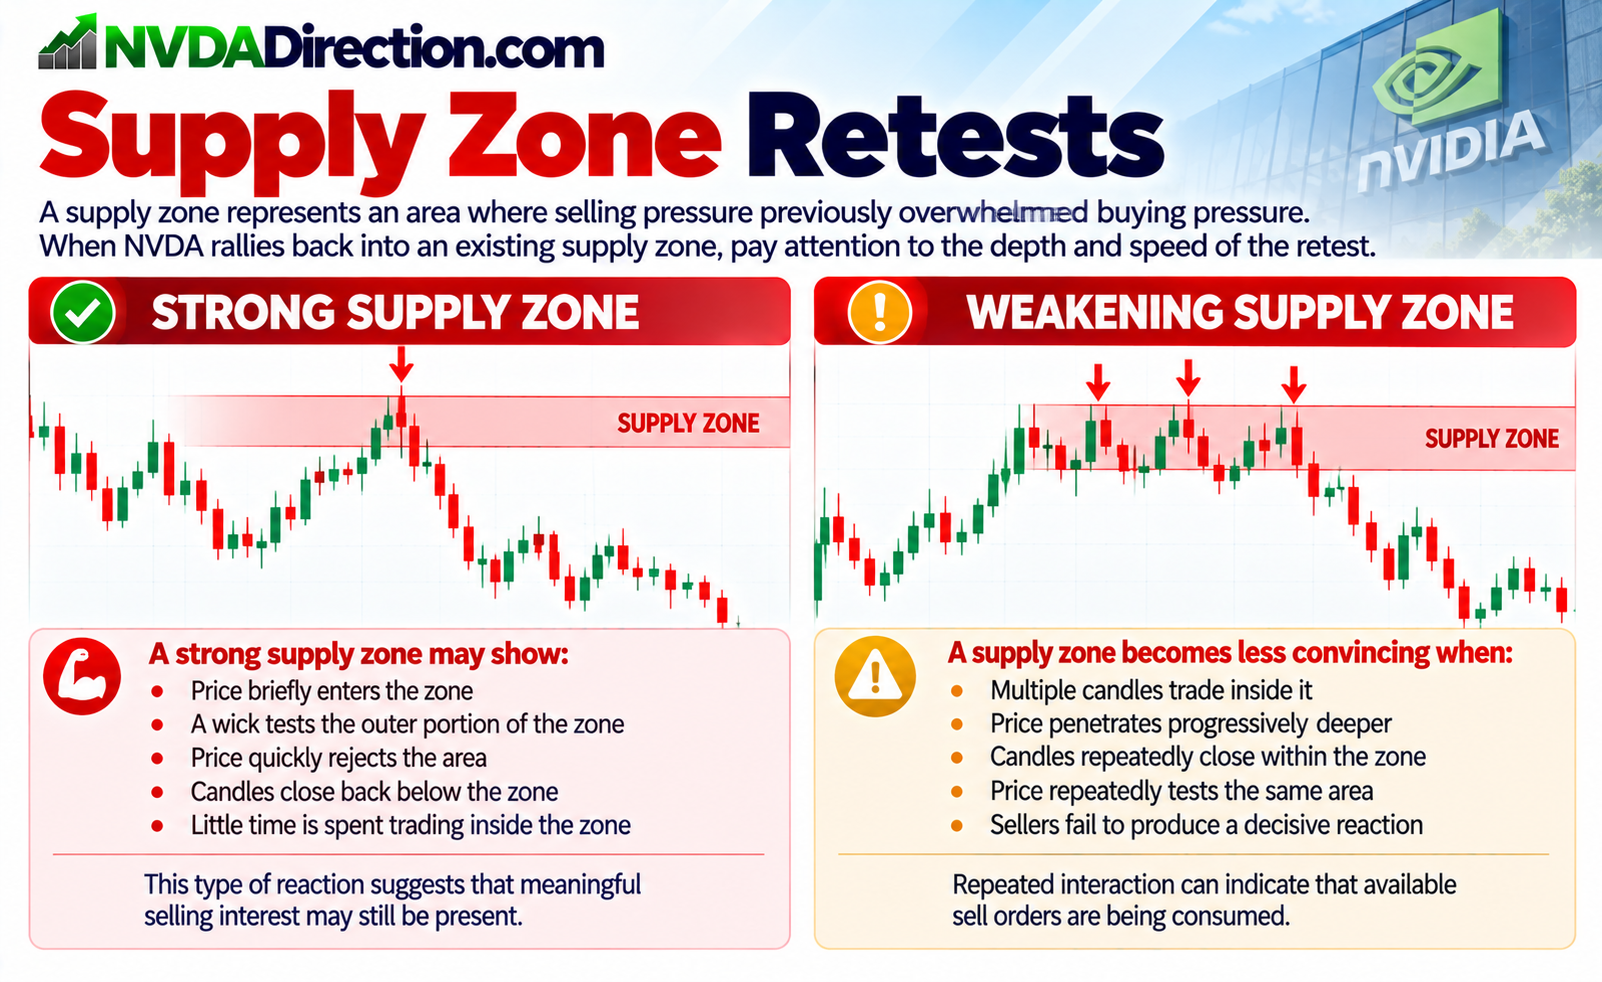
A supply or demand zone is not simply a rectangle on a chart.
Its usefulness depends on how price behaves when it interacts with that area.
Look for:
Shallow penetration → quick rejection → directional follow-through
Be more cautious when you see:
Deep penetration → multiple candles inside → repeated testing → weak reaction
The objective is not to predict that every zone will hold.
The objective is to determine whether the market is still showing evidence of unresolved buying or selling interest.
Bottom Line
Strong zones tend to reject price quickly. Weak zones tend to accept price.