How to earn consistent income with NVDA Direction without blowing up
Contact customer support at support@nvdadirection.com
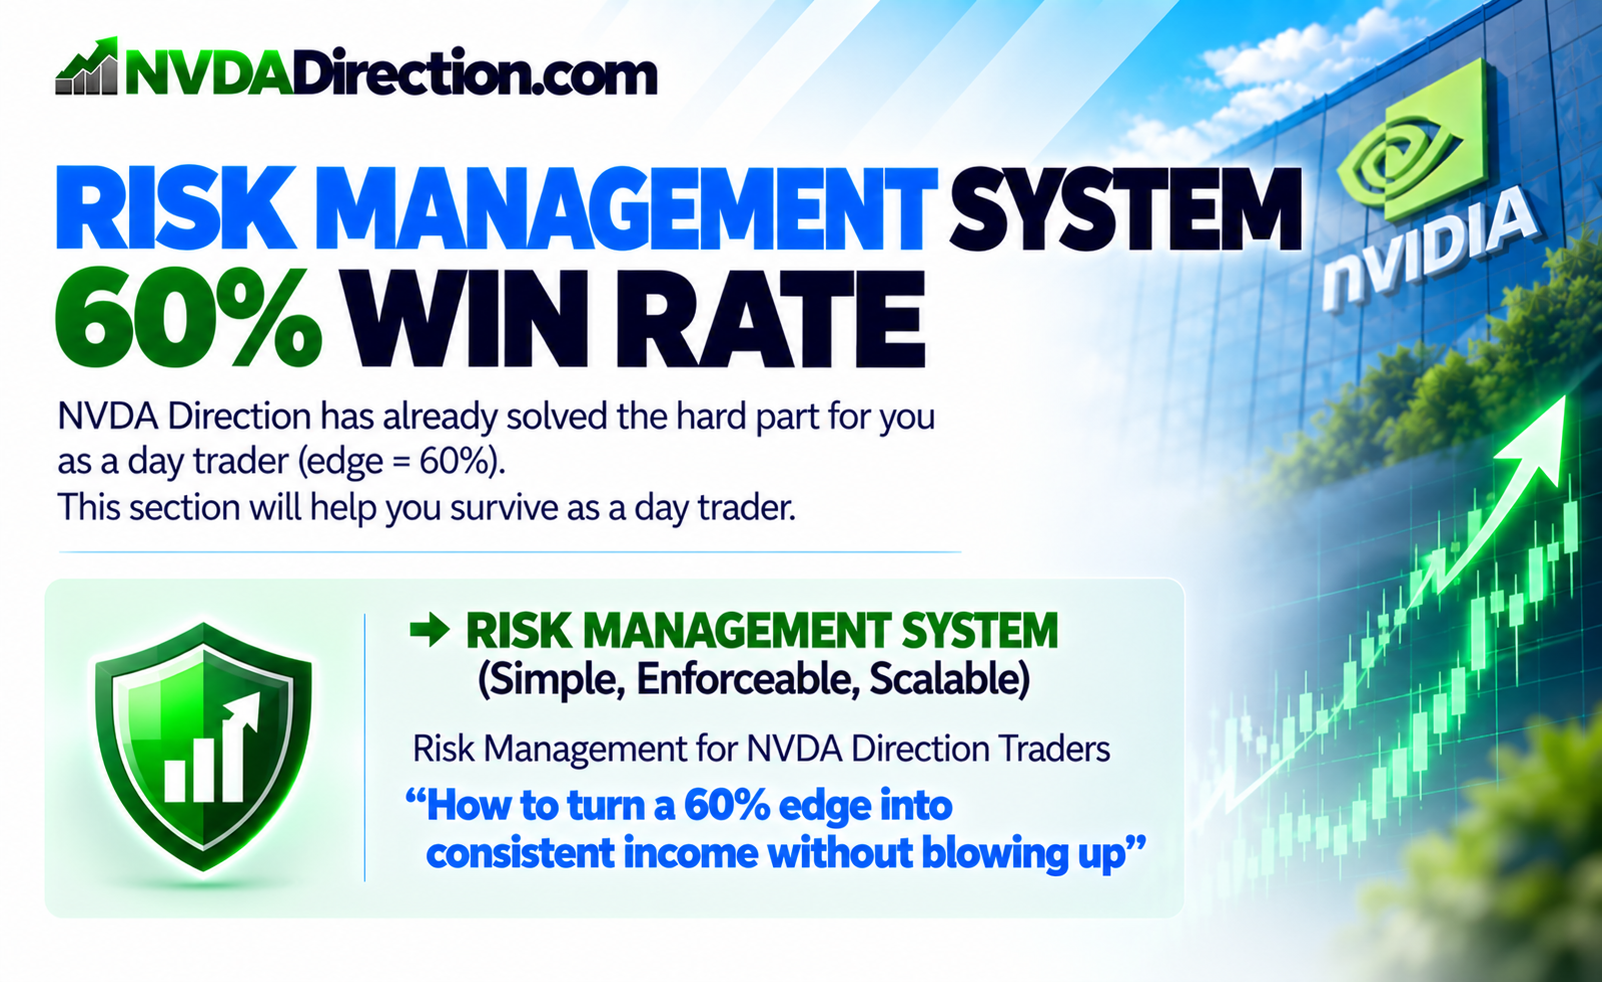
📉 RISK MANAGEMENT SYSTEM — 60% WIN RATE
NVDA Direction has already solved the hard part for you as a day trader (edge = 60%).
This section will help you survive as a day trader:
👉 RISK MANAGEMENT SYSTEM (Simple, Enforceable, Scalable)
Risk Management for NVDA Direction Traders
“How to turn a 60% edge into consistent income without blowing up”
🧠 THE HARSH TRUTH
👉 Most traders don’t fail because of bad entries
👉 They fail because of position sizing + behavior
“A 60% edge without risk control = eventual account blow-up”

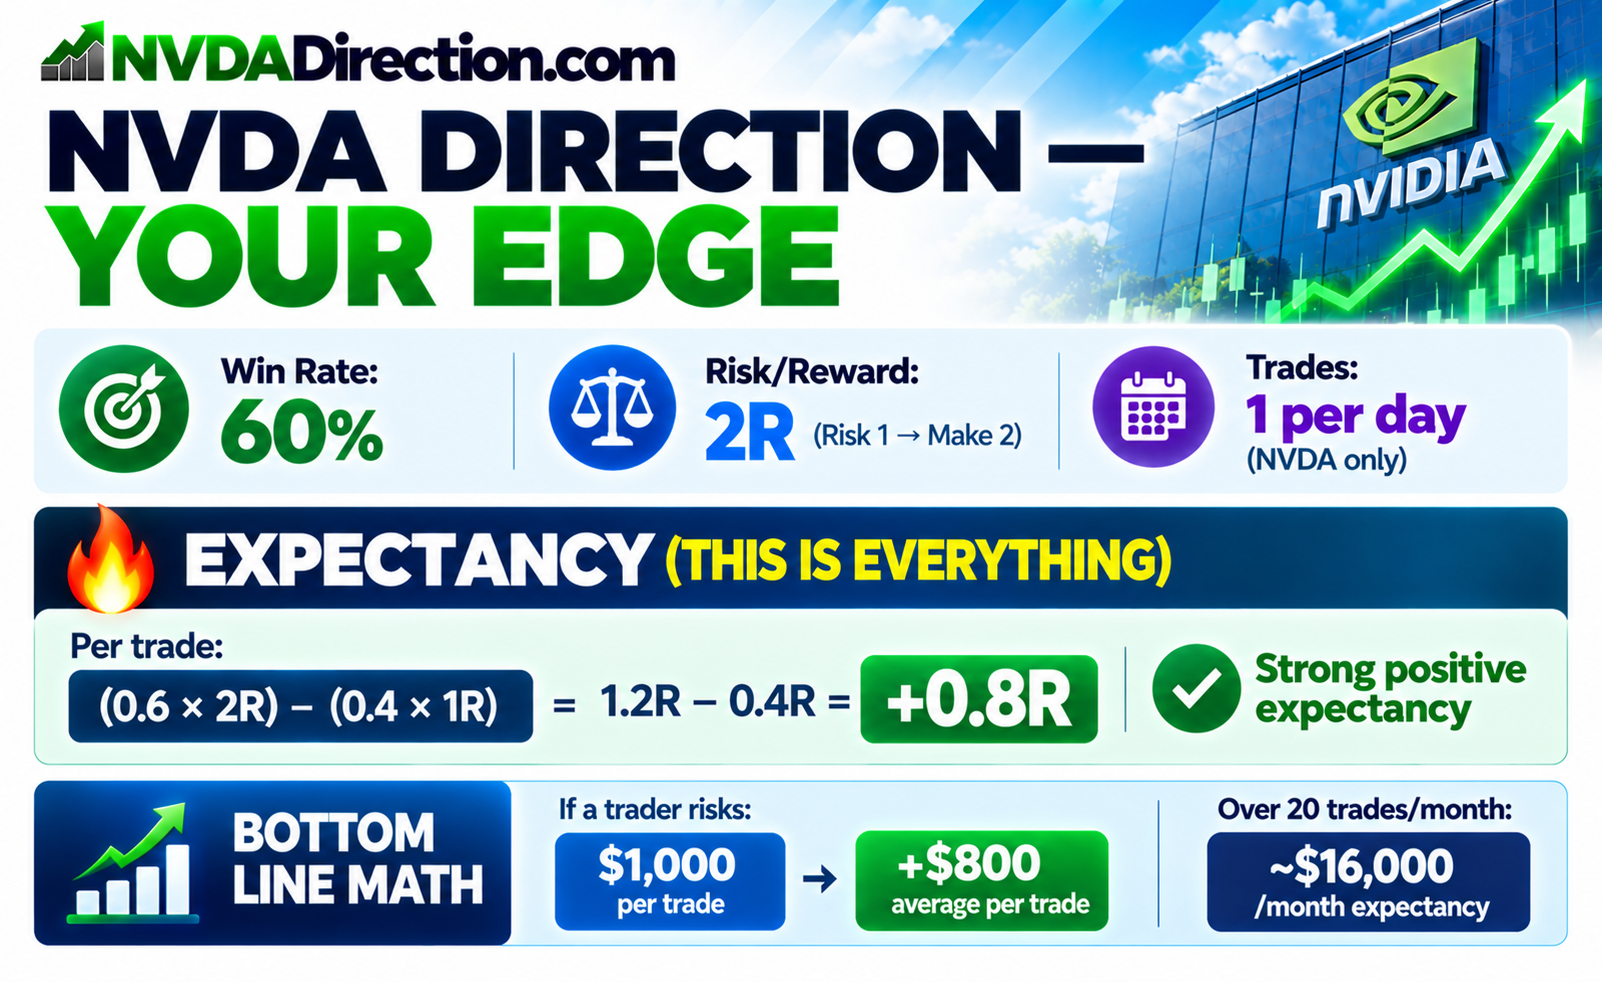
📊 NVDA DIRECTION — YOUR EDGE
-
Win Rate: 60%
-
Risk/Reward: 2R (Risk 1 → Make 2)
-
Trades: 1 per day (NVDA only)
🔥 EXPECTANCY (THIS IS EVERYTHING)
👉 Per trade:
(0.6 × 2R) − (0.4 × 1R) = 1.2R − 0.4R = +0.8R
👉 Strong positive expectancy
📈 BOTTOM LINE MATH
If a trader risks:
-
$1,000 per trade →
👉 +$800 average per trade
Over 20 trades/month:
👉 ~$16,000/month expectancy
🚨 WHY TRADERS STILL BLOW UP
Even with a 60% win rate:
Most traders:
-
Increase size after wins
-
Revenge trade after losses
-
Take multiple trades per day
-
Ignore stop losses
👉 They override math with emotion
For more information about Stop Loss & Risk Management, click here.

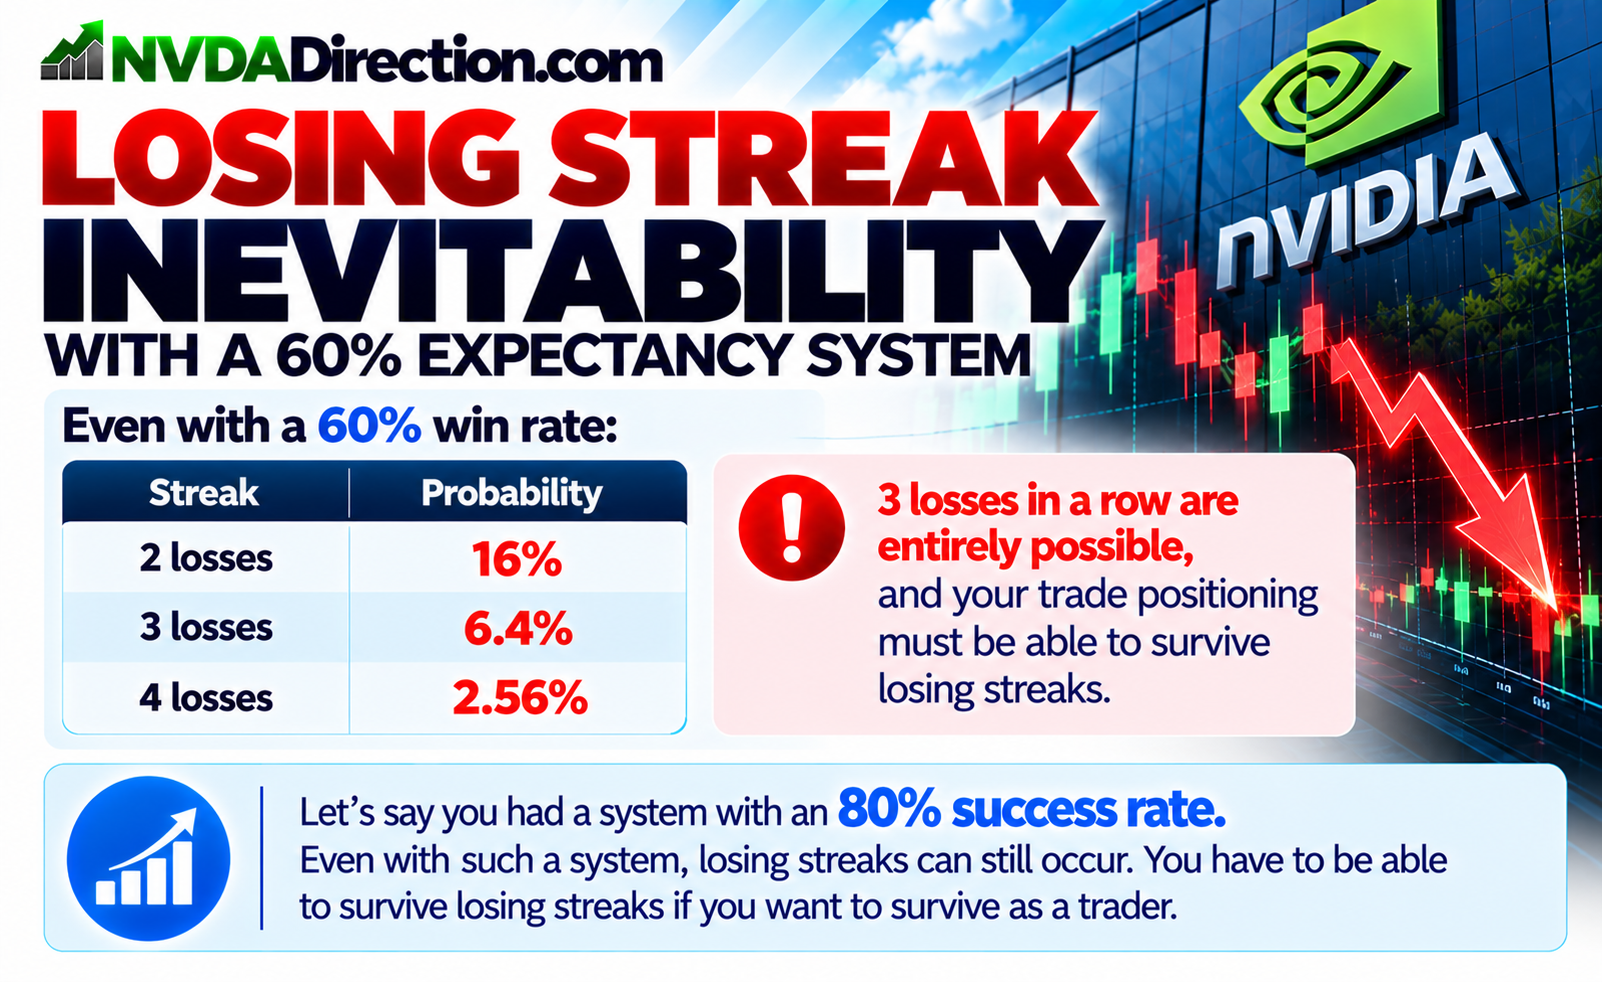
📉 LOSING STREAK INEVITABILITY WITH A 60% EXPECTANCY SYSTEM
Even with a 60% win rate:
| Streak | Probability |
|---|---|
| 2 losses | 16% |
| 3 losses | 6.4% |
| 4 losses | 2.56% |
👉 3 losses in a row are entirely possible, and your trade positioning must be able to survive losing streaks.
Let's say you had a system with an 80% success rate. Even with such a system, losing streaks can still occur. You have to be able to survive losing streaks if you want to survive as a trader.
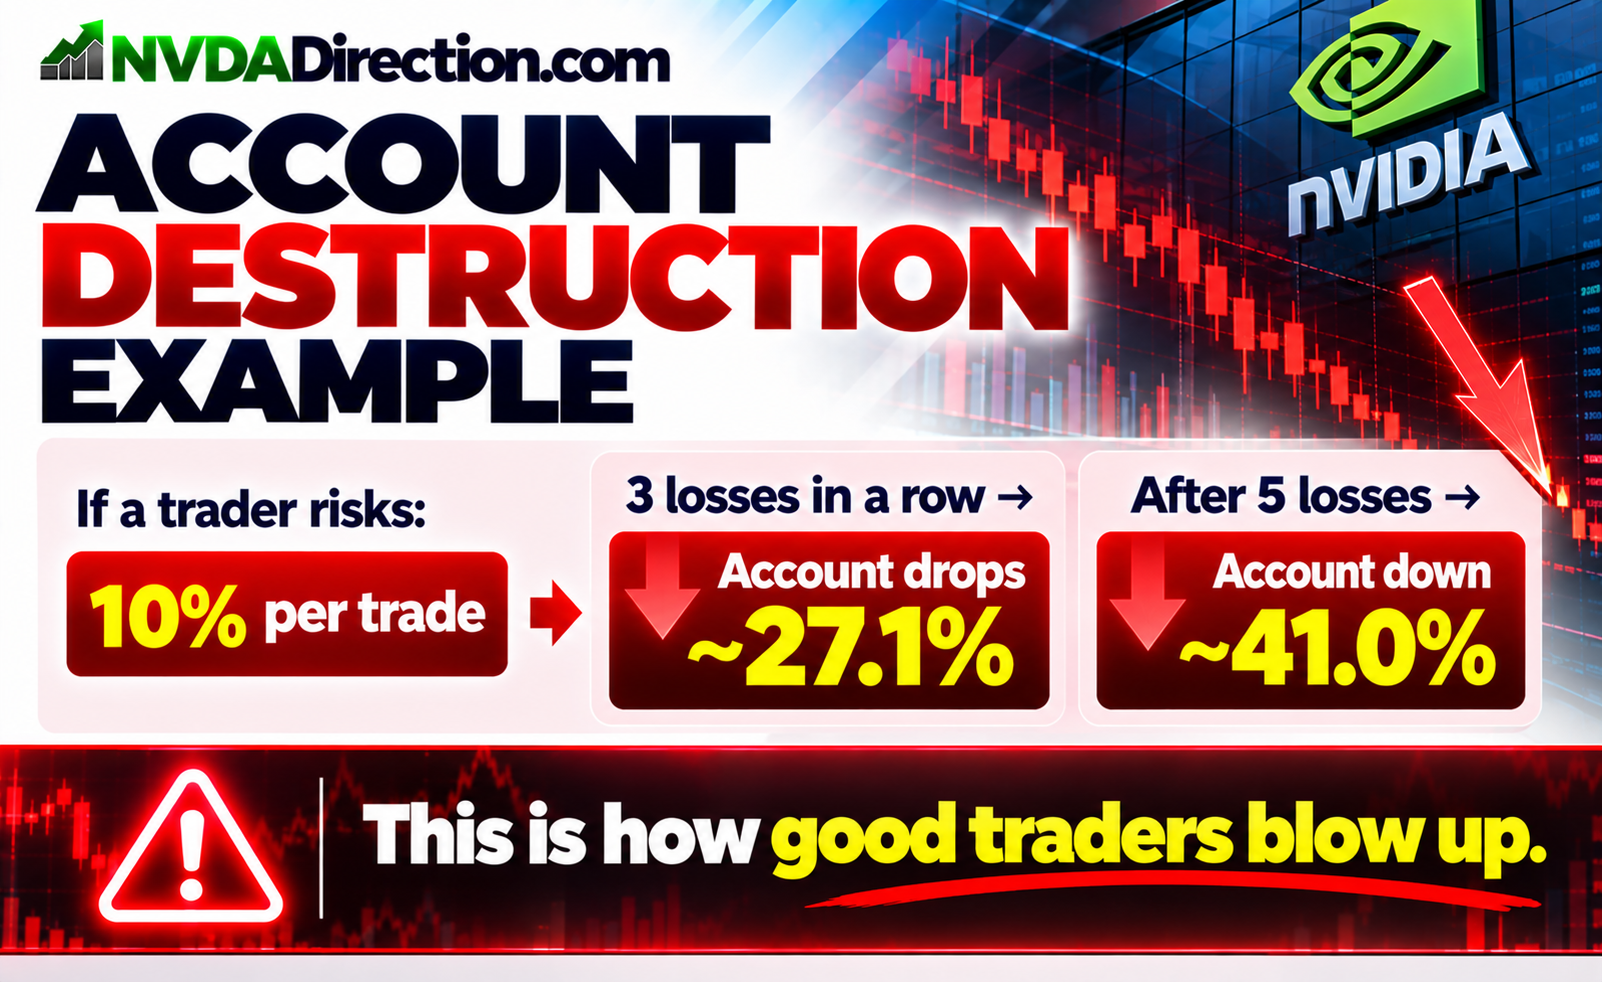
💥 ACCOUNT DESTRUCTION EXAMPLE
If a trader risks:
-
10% per trade
-
3 losses in a row →
👉 Account drops ~27.1%
After 5 losses:
👉 Account down ~41.0%
👉 This is how good traders blow up
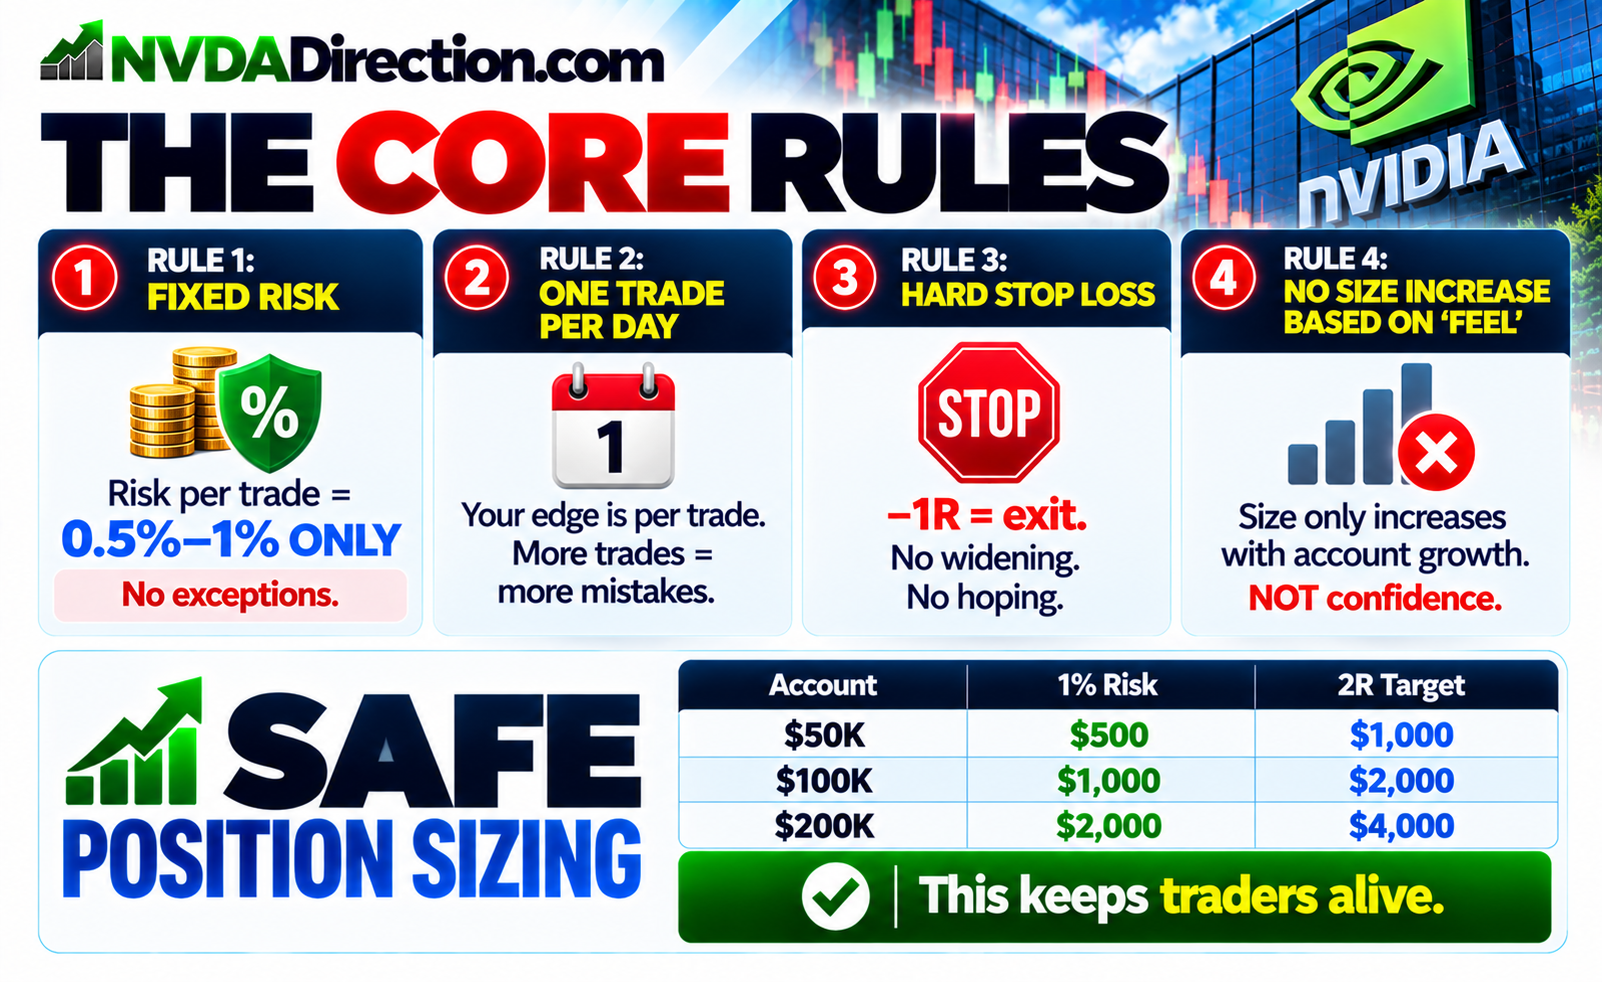
🛡️ THE CORE RULES
🔒 RULE 1: FIXED RISK
👉 Risk per trade = 0.5%–1% ONLY
No exceptions.
🔒 RULE 2: ONE TRADE PER DAY
👉 Your edge is per trade
👉 More trades = more mistakes
🔒 RULE 3: HARD STOP LOSS
👉 −1R = exit
No widening
No hoping
🔒 RULE 4: NO SIZE INCREASE BASED ON 'FEEL'
👉 Size only increases with account growth
NOT confidence
📊 SAFE POSITION SIZING
| Account | 1% Risk | 2R Target |
|---|---|---|
| $50K | $500 | $1,000 |
| $100K | $1,000 | $2,000 |
| $200K | $2,000 | $4,000 |
👉 This keeps traders alive
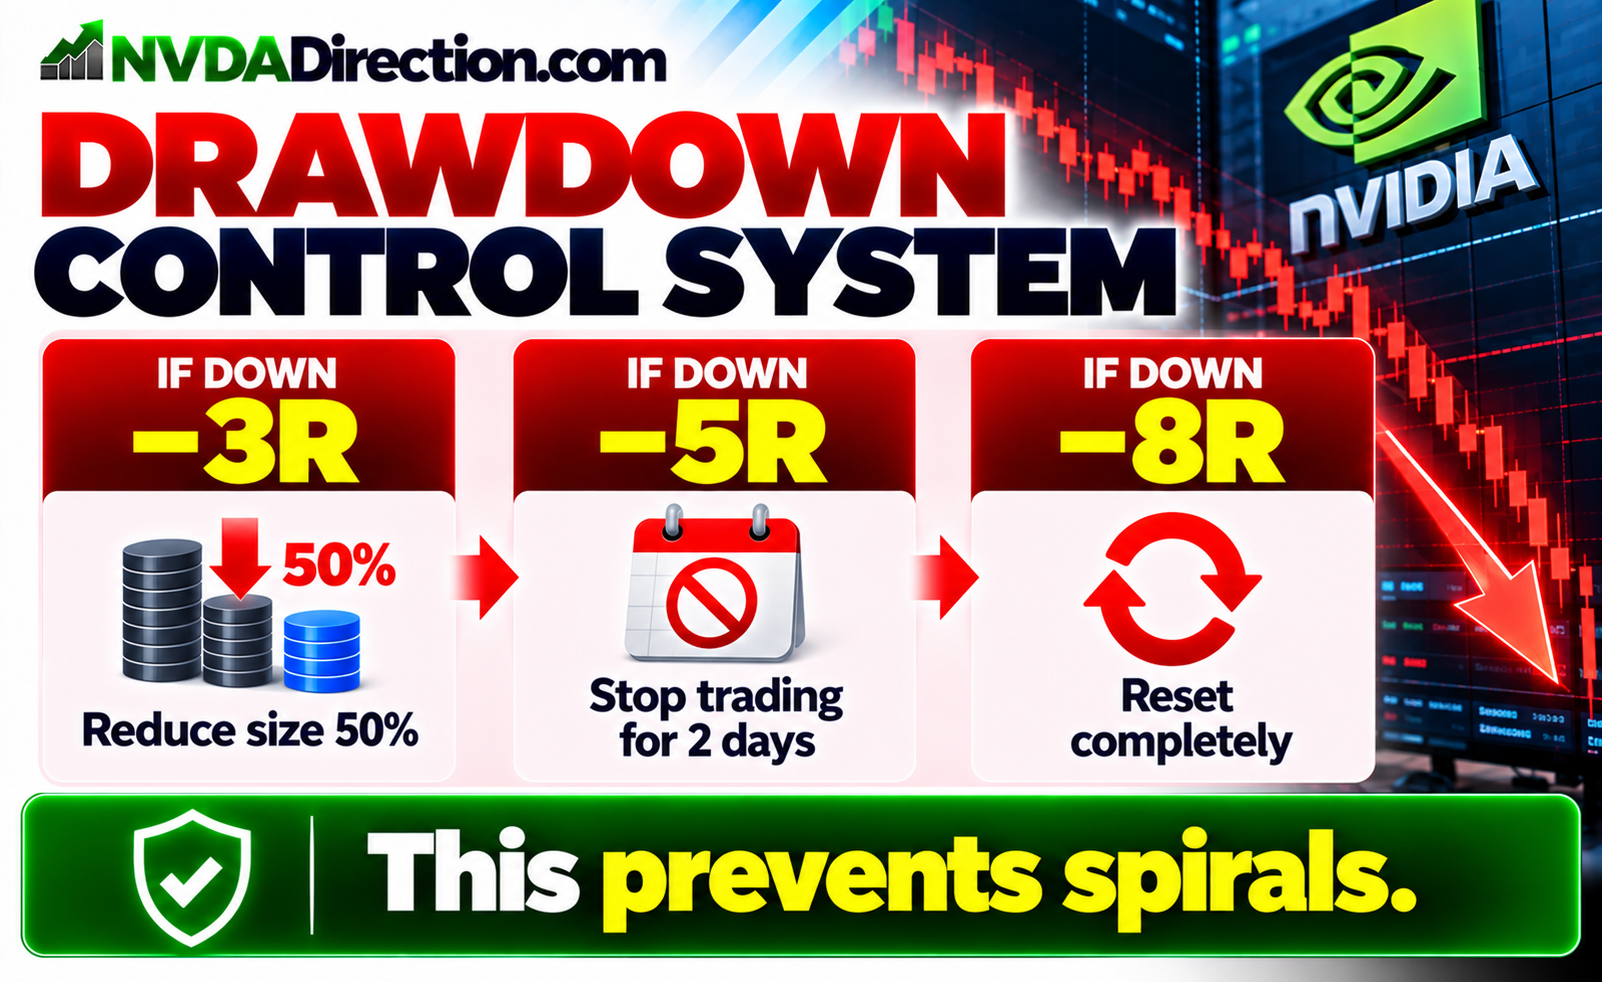
📉 DRAWDOWN CONTROL SYSTEM
🔻 If down:
-
−3R → reduce size 50%
-
−5R → stop trading for 2 days
-
−8R → reset completely
👉 This prevents spirals
🧠 THE PSYCHOLOGY RULE
👉 After win streak:
-
DO NOT increase size
👉 After loss:
-
DO NOT chase
“Same trade. Same size. Every day.”

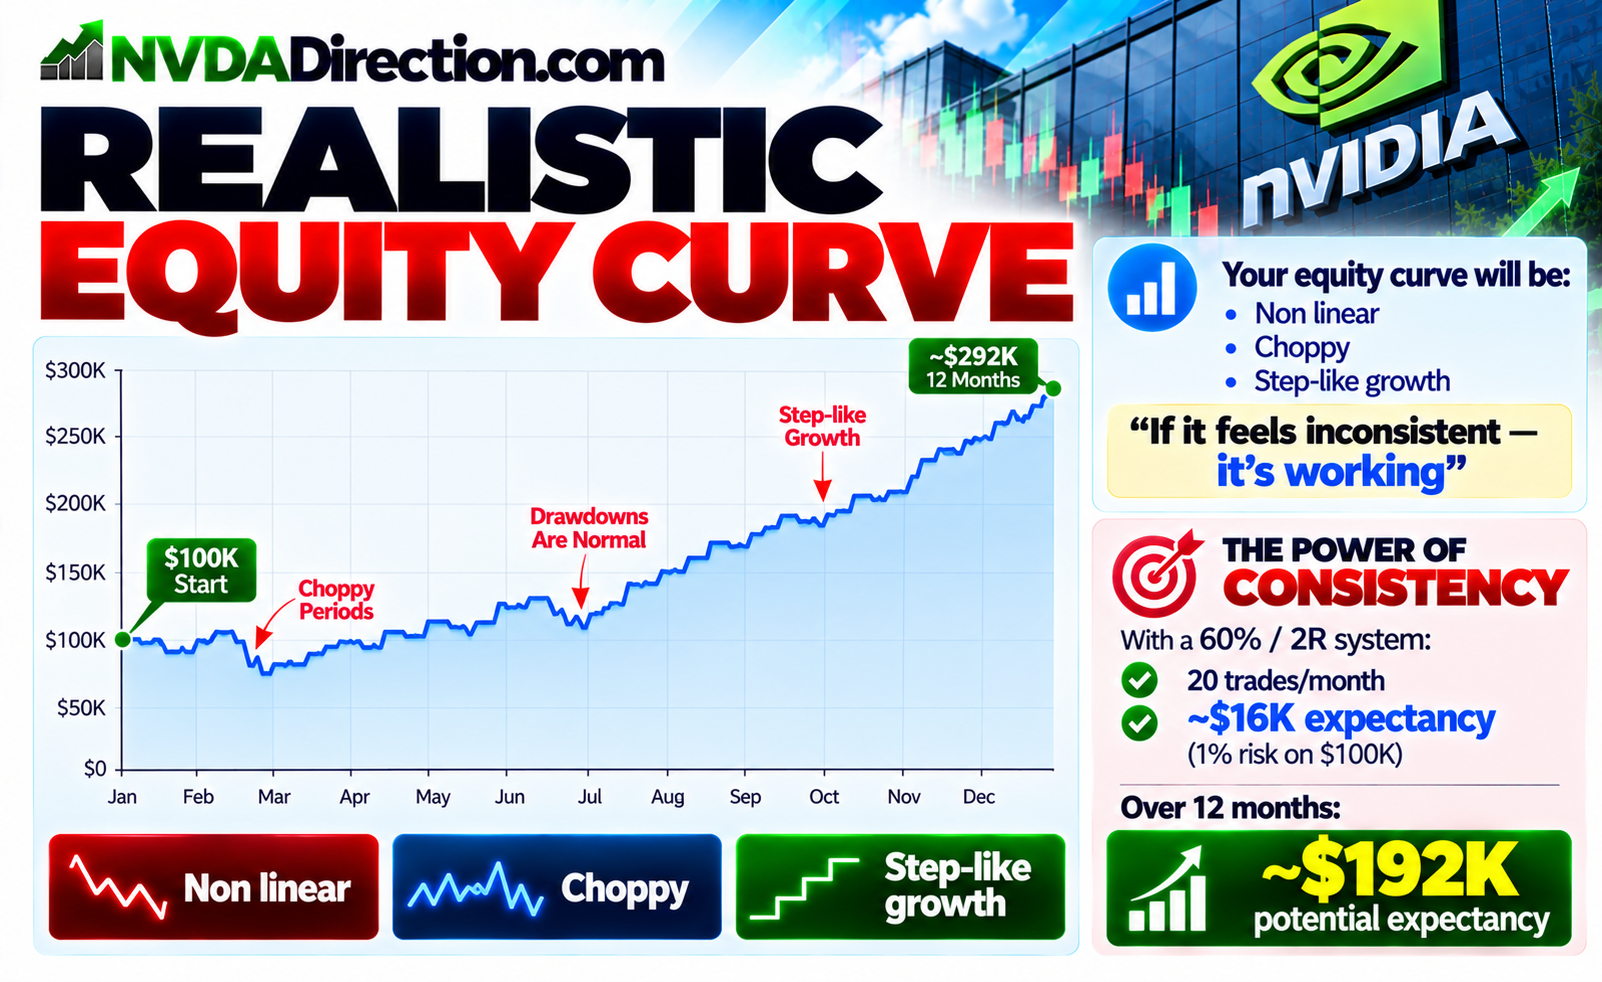
📊 REALISTIC EQUITY CURVE
Your equity curve will be:
-
Non linear
-
Choppy
-
Step-like growth
👉 “If it feels inconsistent — it’s working”
🔥 THE POWER OF CONSISTENCY
With a 60% / 2R system:
👉 Even with discipline only:
-
20 trades/month
-
~$16K expectancy (1% risk on $100K)
👉 Over 12 months:
~$192K potential expectancy
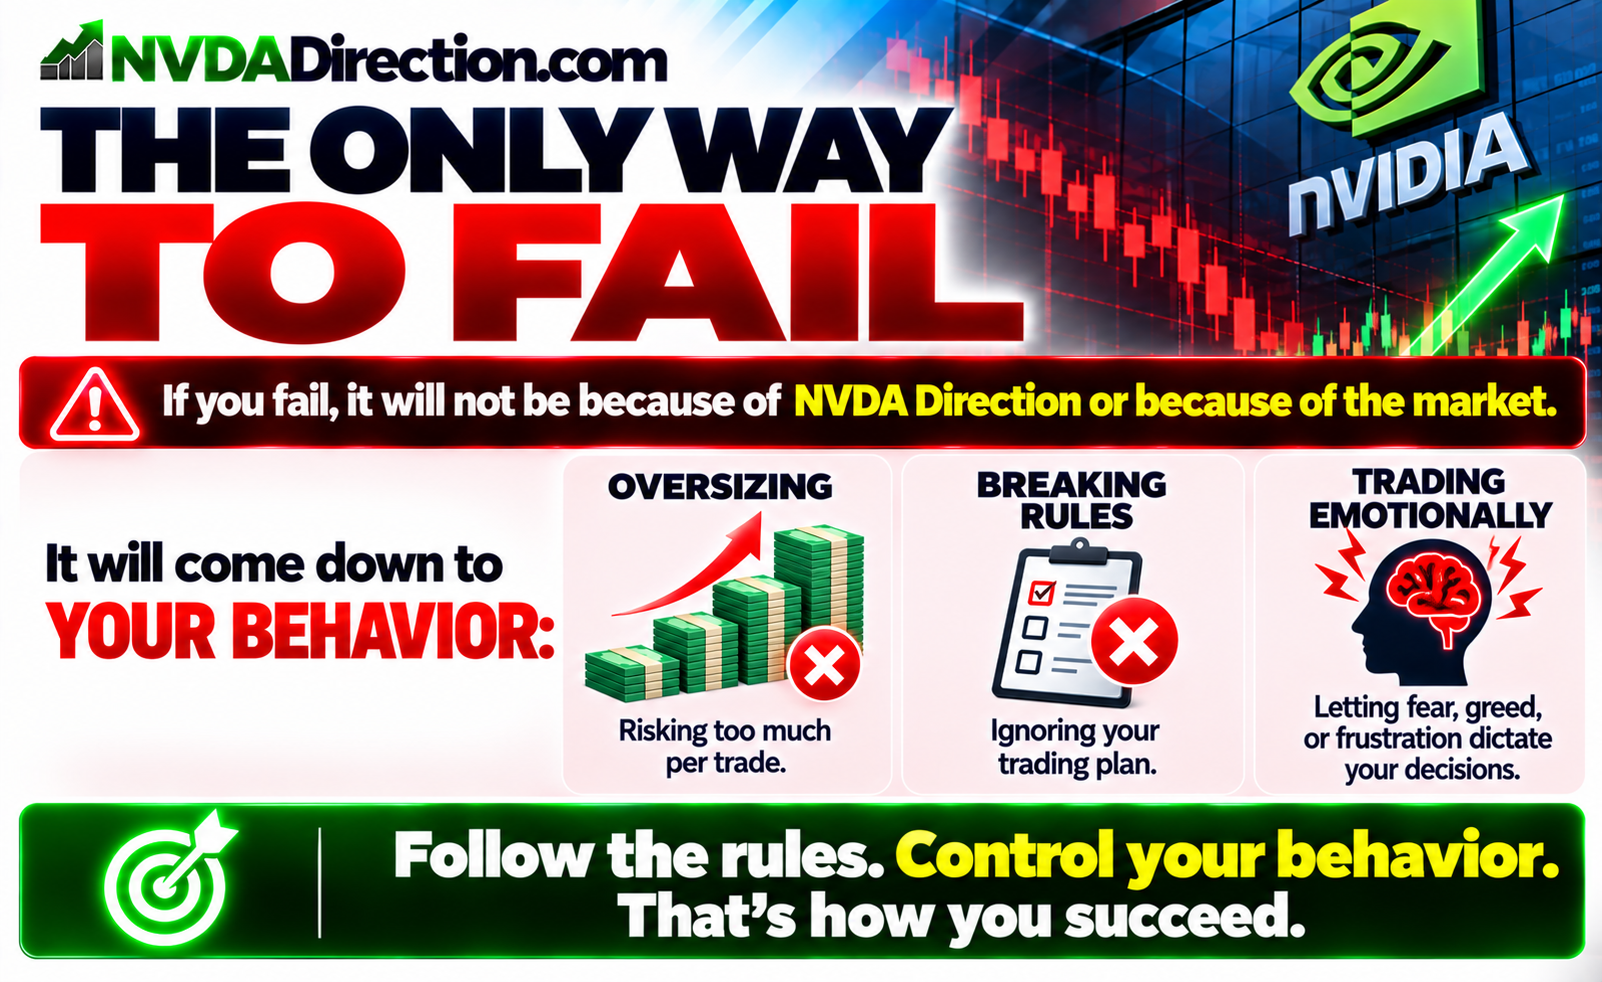
🚨 THE ONLY WAY TO FAIL
If you fail, it will not be because of NVDA Direction or because of the market.
👉 It will come down to your behavior:
-
Oversizing
-
Breaking rules
🛡️ YOUR PROTOCOL
Daily Checklist:
-
1 trade only
-
Risk = fixed %
-
Stop = honored
-
No revenge
-
No size change
💡 BEFORE YOU TAKE A TRADE, REMEMBER:
👉 You already have the edge
Now protect it
“Your edge makes you money.
Your discipline lets you keep it.”
🔥 NVDA DIRECTION SYSTEM:
| Metric | Value |
|---|---|
| Win Rate | 60% |
| Risk Reward Multiple | 2R |
| Expectancy | +0.8R per trade |
📊 THE MATH IS ON YOUR SIDE
👉 Every trade is worth:
+$0.80 for every $1 risked
Example:
| Risk | Expected Value |
|---|---|
| $500 | +$400 |
| $1,000 | +$800 |
| $2,000 | +$1,600 |
👉 This is powerful positive expectancy
👉 But ONLY if our members survive over a large number of trades
📉 REQUIRED WIN RATE
With 2R:
👉 You only need ~33.3% win rate to break even
NVDA DIRECTION TRADERS ALREADY HAVE A 60% WIN RATE.
👉 60% win rate:
“You already have the required edge —
If you blow up your account, it is a risk management failure.”

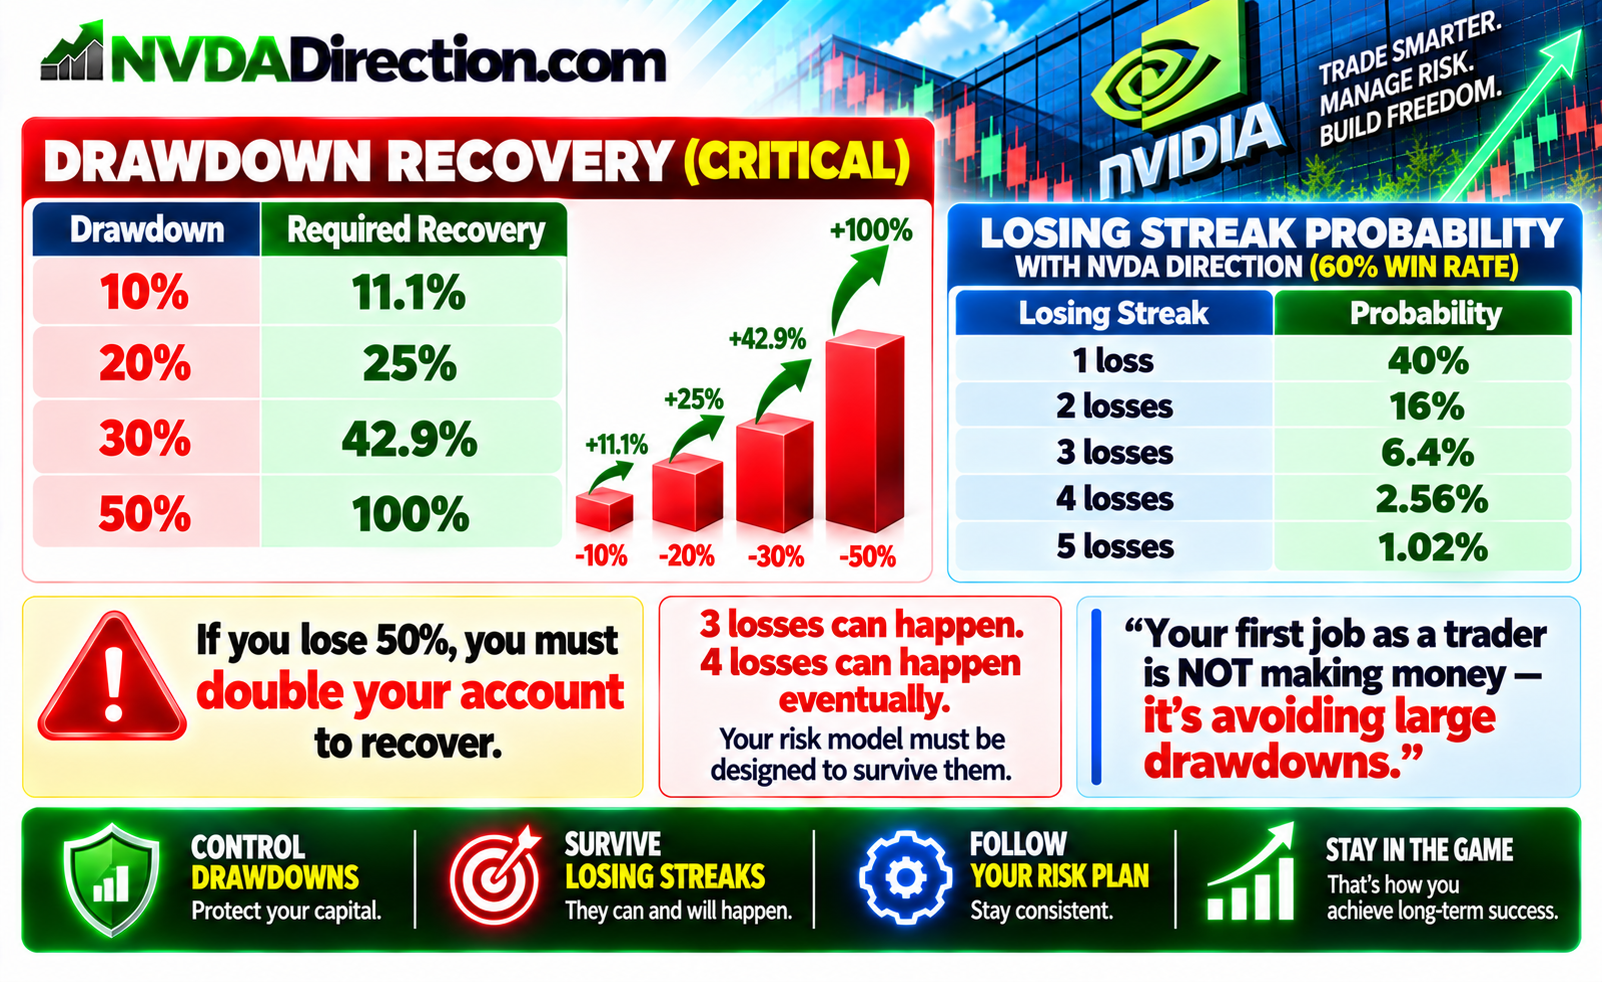
📉 DRAWDOWN RECOVERY (CRITICAL)
| Drawdown | Required Recovery |
|---|---|
| 10% | 11.1% |
| 20% | 25% |
| 30% | 42.9% |
| 50% | 100% |
👉 If you lose 50%, you must double your account to recover. Therefore....
“Your first job as a trader is NOT making money — it’s avoiding large drawdowns.”
📊 LOSING STREAK PROBABILITY WITH NVDA DIRECTION (60% WIN RATE)
| Losing Streak | Probability |
|---|---|
| 1 loss | 40% |
| 2 losses | 16% |
| 3 losses | 6.4% |
| 4 losses | 2.56% |
| 5 losses | 1.02% |
🔥 KEY INSIGHT:
👉 3 losses can happen
👉 4 losses can happen eventually
Your risk model must be designed to survive them.
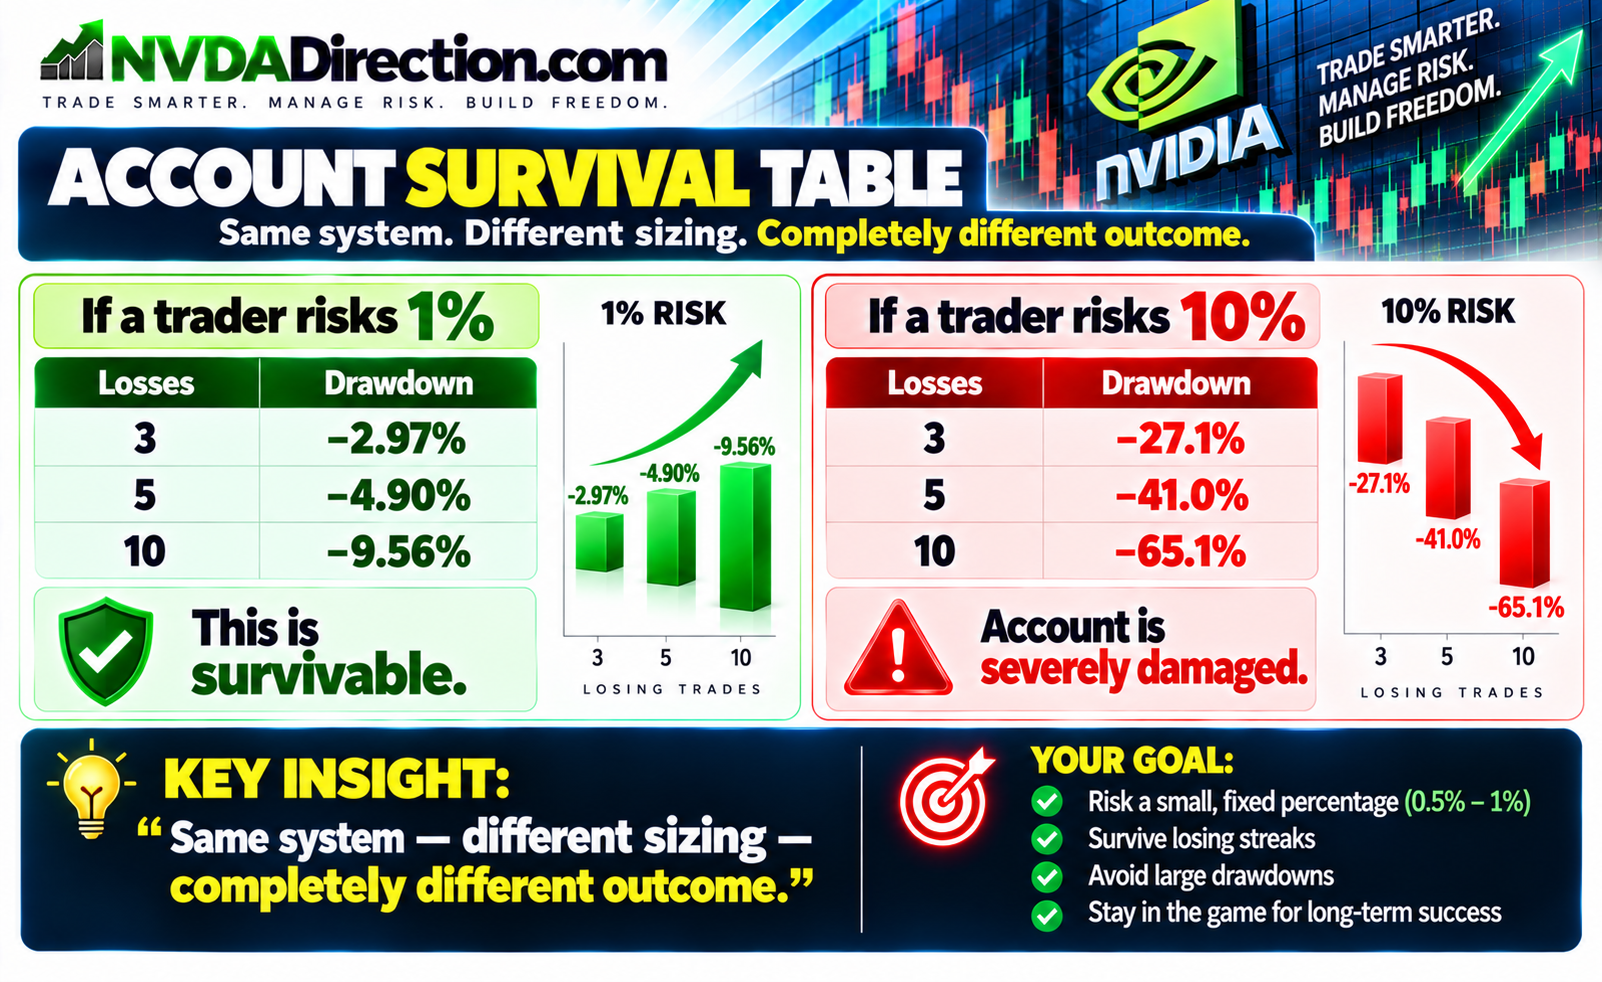
💥 ACCOUNT SURVIVAL TABLE
If a trader risks 1%:
| Losses | Drawdown |
|---|---|
| 3 | −2.97% |
| 5 | −4.90% |
| 10 | −9.56% |
👉 This is survivable
If a trader risks 10%:
| Losses | Drawdown |
|---|---|
| 3 | −27.1% |
| 5 | −41.0% |
| 10 | −65.1% |
👉 Account is severely damaged
🔥 KEY INSIGHT:
“Same system — different sizing — completely different outcome.”
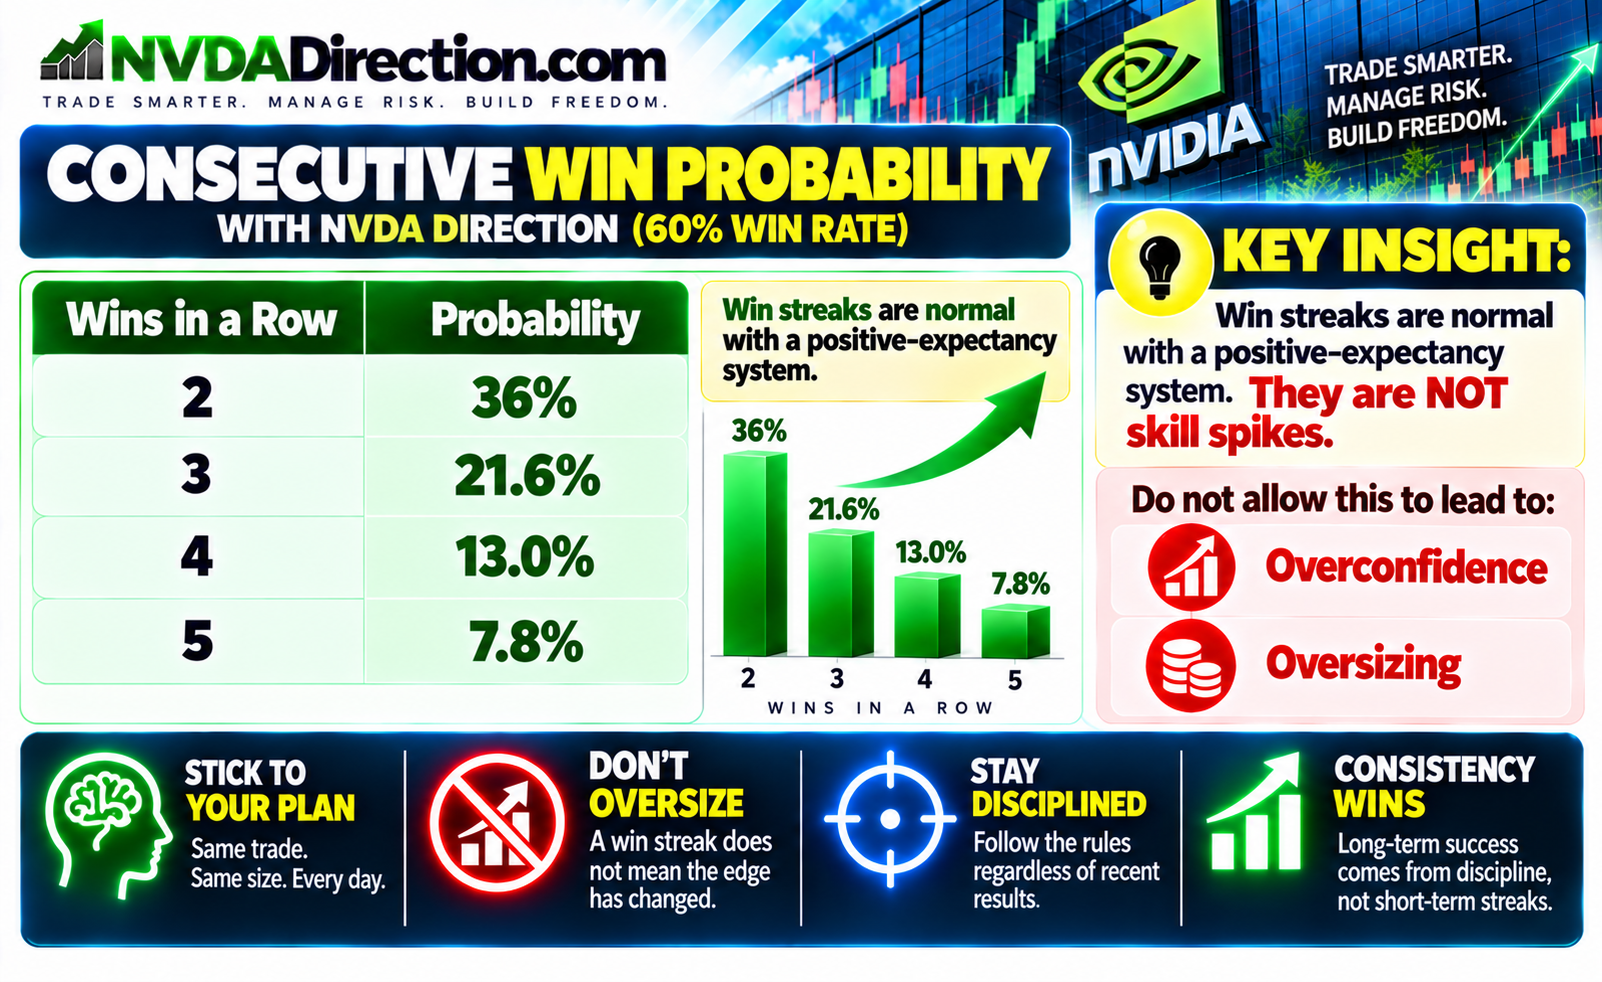
📊 CONSECUTIVE WIN PROBABILITY WITH NVDA DIRECTION (60% WIN RATE)
| Wins in a Row | Probability |
|---|---|
| 2 | 36% |
| 3 | 21.6% |
| 4 | 13.0% |
| 5 | 7.8% |
🔥 KEY INSIGHT:
👉 Win streaks are normal with a positive-expectancy system
👉 They are NOT skill spikes
👉 Do not allow this to lead to:
-
Overconfidence
-
Oversizing
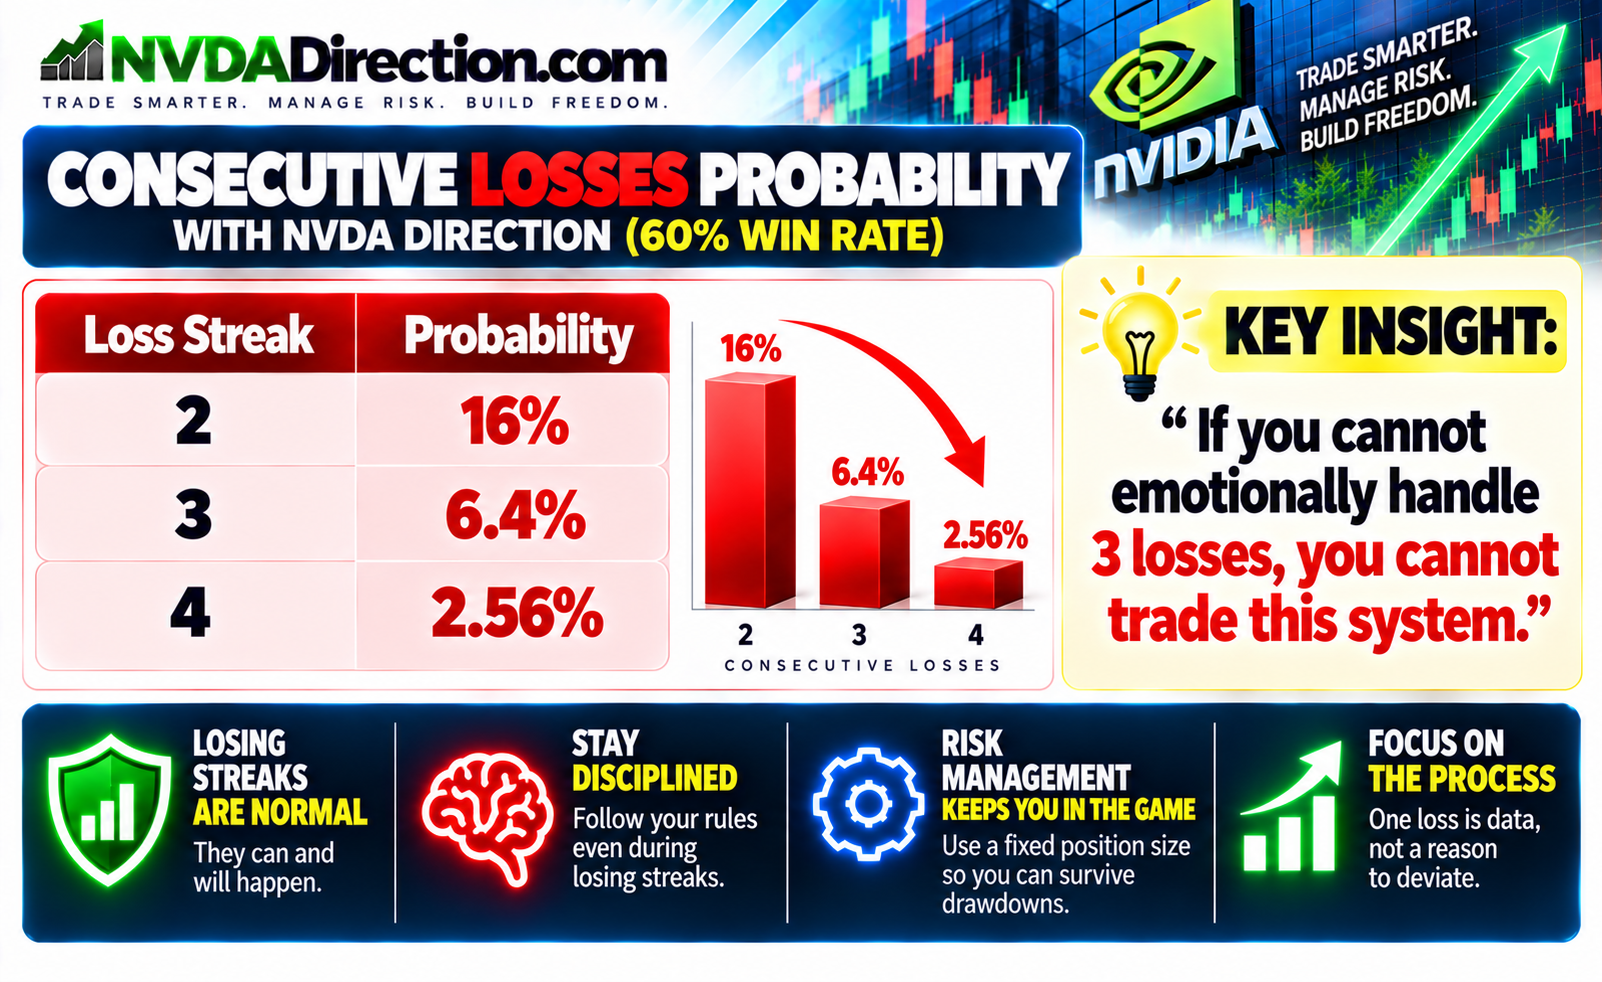
📊 CONSECUTIVE LOSSES PROBABILITY WITH NVDA DIRECTION
| Loss Streak | Probability |
|---|---|
| 2 | 16% |
| 3 | 6.4% |
| 4 | 2.56% |
🔥 KEY INSIGHT:
“If you cannot emotionally handle 3 losses, you cannot trade this system.”
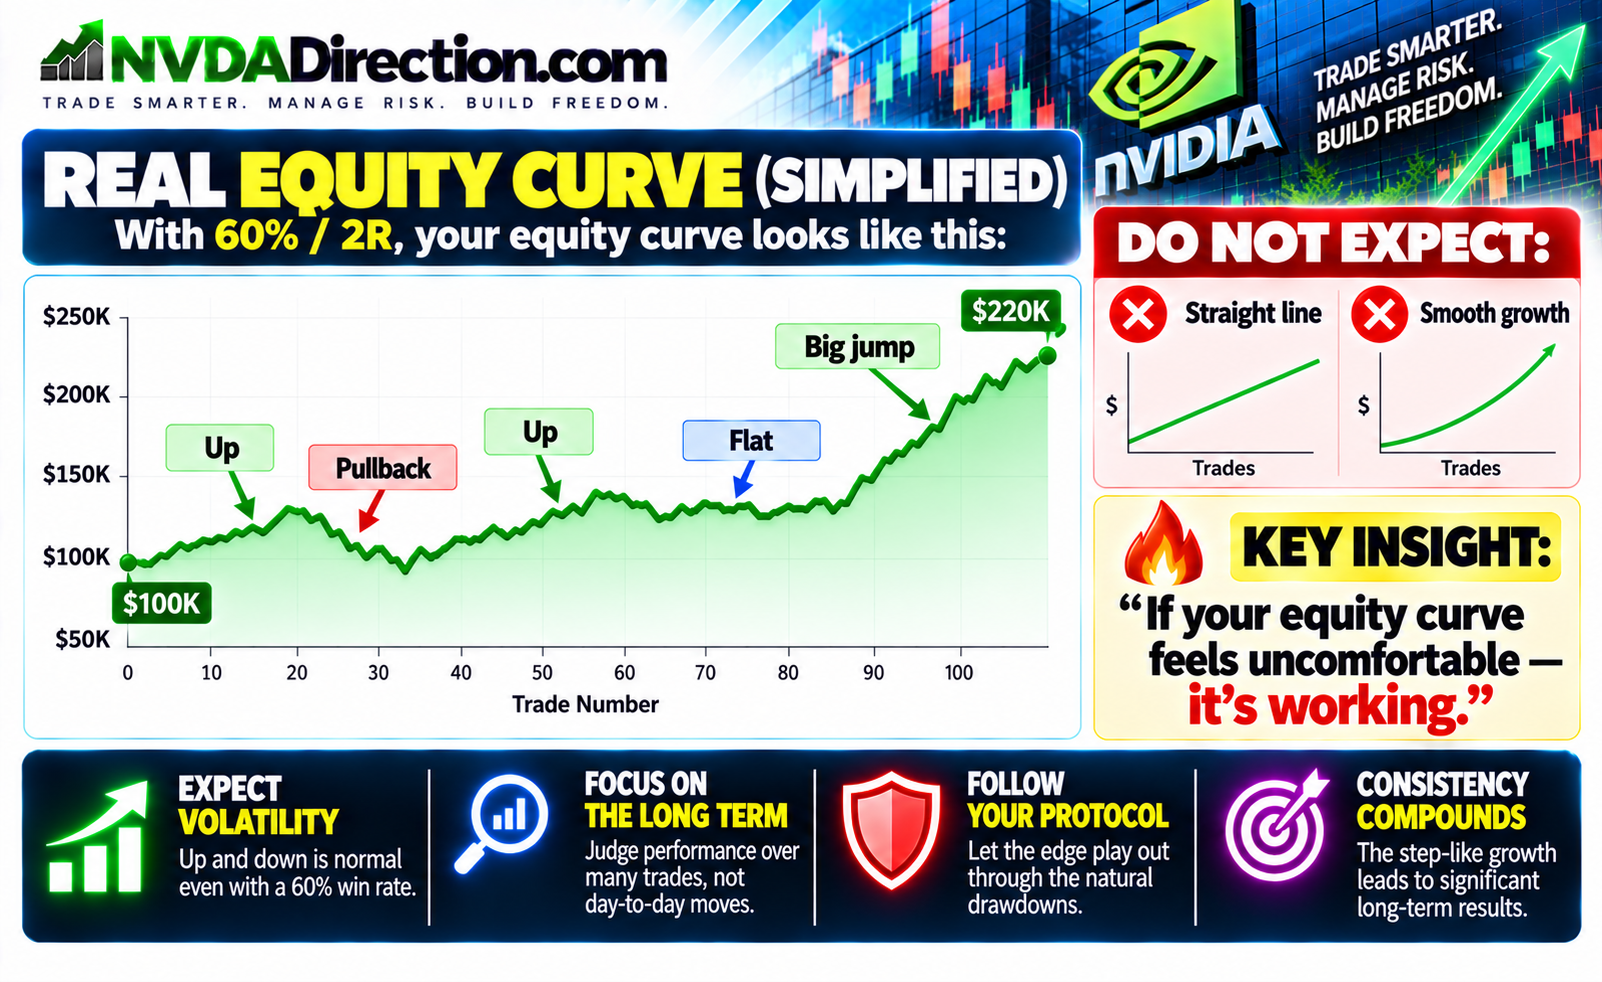
📈 REAL EQUITY CURVE (SIMPLIFIED)
👉 With 60% / 2R:
Your curve looks like:
-
Up
-
Pullback
-
Up
-
Flat
-
Big jump
DO NOT EXPECT:
❌ Straight line
❌ Smooth growth
🔥 KEY INSIGHT:
“If your equity curve feels uncomfortable — it’s working.”
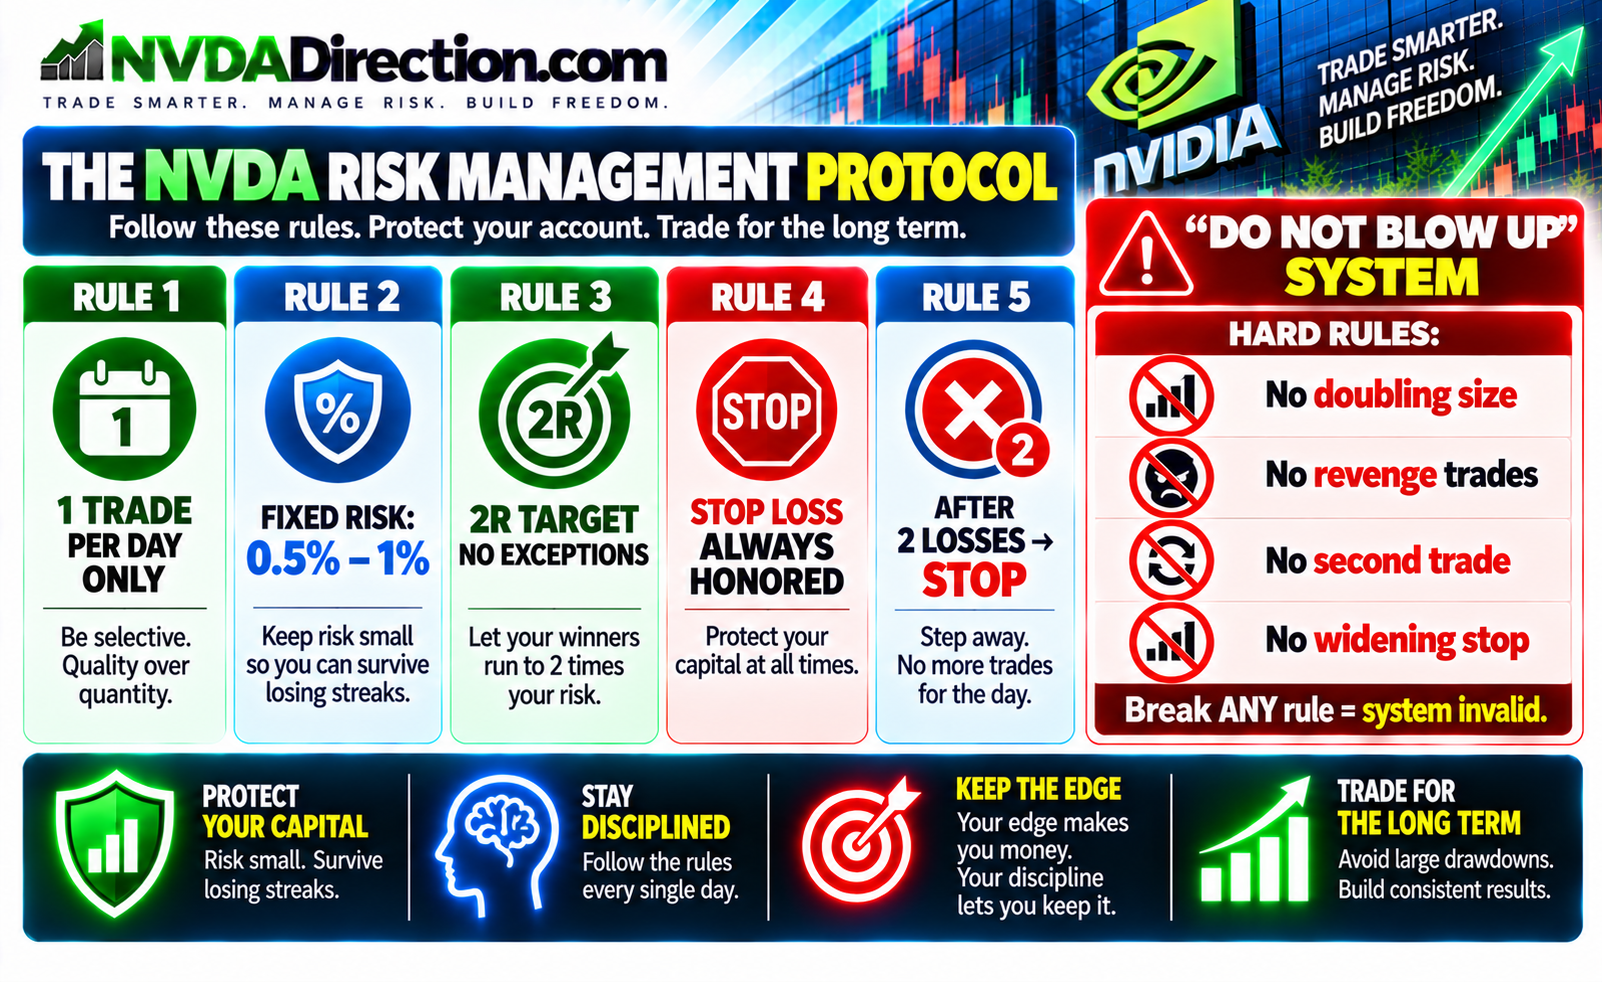
🛡️ THE NVDA RISK MANAGEMENT PROTOCOL
🔒 RULE 1
👉 1 trade per day ONLY
🔒 RULE 2
👉 Fixed risk: 0.5%–1%
🔒 RULE 3
👉 2R target — NO exceptions
🔒 RULE 4
👉 Stop loss ALWAYS honored
🔒 RULE 5
👉 After 2 losses → STOP
🚨 “DO NOT BLOW UP” SYSTEM
Hard Rules:
-
No doubling size
-
No revenge trades
-
No second trade
-
No widening stop
👉 Break ANY rule = system invalid
🧠 THE BIG IDEA (MOST IMPORTANT)
Tie everything together:
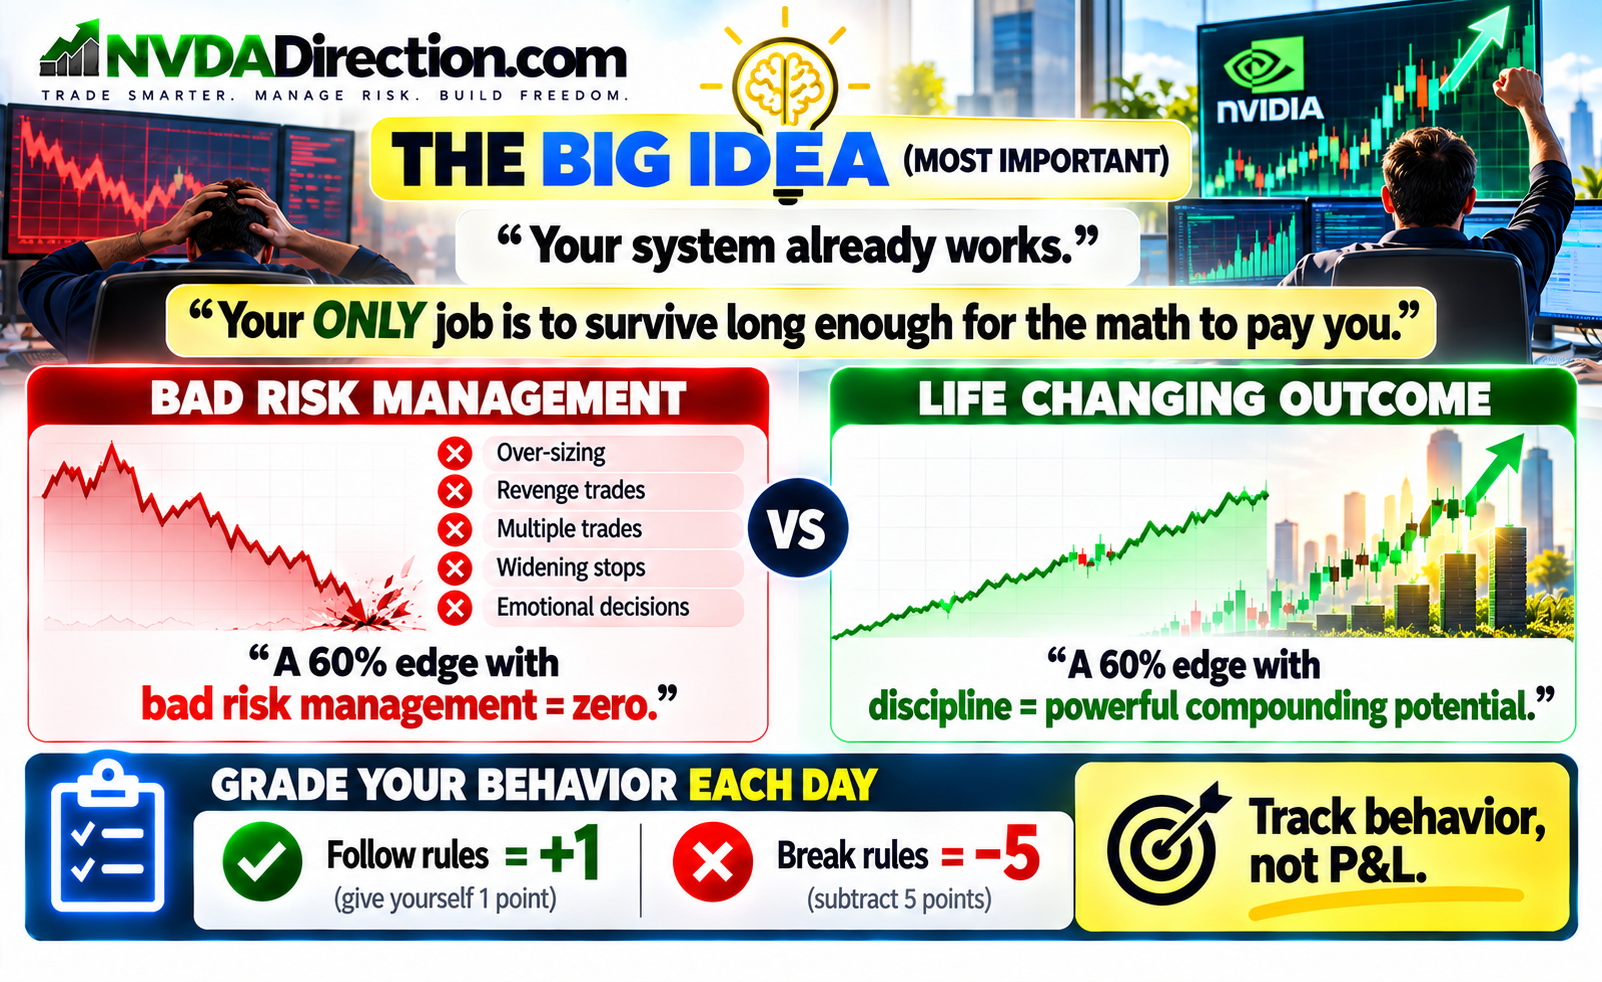
“Your system already works.”
“Your ONLY job is to survive long enough for the math to pay you.”
🔥 BAD RISK MANAGEMENT vs LIFE CHANGING OUTCOME — THE CHOICE IS YOURS
“A 60% edge with bad risk management = zero.”
“A 60% edge with discipline = powerful compounding potential.”
⚡ GRADE YOUR BEHAVIOR EACH DAY
Each day:
-
Follow rules = +1 (give yourself 1 point)
-
Break rules = −5 (subtract 5 points)
👉 Track behavior, not P&L