The Stock Market is Full of Traps Set by Institutions, The Game is Rigged Against Retail
NVDA Moves $7.50 Every Single Day—But 90% of That Profit Window Slams Shut by 11:30 AM. Miss It, and You're Stuck Watching From the Sidelines. Catch It, and You're Done While Others Are Still Drinking Their Morning Coffee.
NVDA is one of the most predictable stocks in the market. But there's a secret — that movement is concentrated inside one critical 90-minute window.
THE PROPRIETARY NVDA DIRECTION ALGORITHM
VIDA decodes institutional order flow in real time to help identify when to strike and when to walk away.
While retail traders flail around all day chasing NVDA's daily range, institutions make their move in the first 90 minutes and walk away.
VIDA is designed to decode their order flow in real time, helping you focus on the morning window instead of fighting through midday consolidation.
VIDA identifies the setup and gives you the information you need to act.
Catch the breakout or breakdown while the institutional window is active.
Reach your target, close your laptop, and let everyone else fight the midday noise.
Your trading day is done.
While everyone else is still grinding, hoping, and watching their gains evaporate in midday noise.
You watch the move happen. By the time you pull the trigger, you're entering at the worst possible price.
You nail the entry, watch it run toward your target, then exit at breakeven because you don't trust the setup.
You don't know whether you're seeing a real institutional move or simply more market noise.
Dr. Nitin Chhoda isn't your typical trading guru.
He lost over $2 million of his own money trading options on the Mag7 stocks — including his trading account and IRA accounts.
Emotional entries based on FOMO and headlines.
No respect for risk limits or position sizing.
Chasing breakouts without institutional confirmation.
Trading outside the optimal liquidity windows.
Holding positions through theta-bleeding midday chop.
At rock bottom, Dr. Chhoda made a decision: go back to the drawing board and re-engineer the entire approach from scratch.
He spent more than 10,000 hours analyzing price action, momentum and volume across ES, QQQ, SMH and NVDA.
He built custom algorithms on AWS and Azure to parse institutional order flow and studied depth-of-book mechanics to identify where large limit walls were being positioned.
He started executing these setups manually. Tracking every entry, stop, target and result.
Slowly — trade by trade, week by week — he recovered the entire $2 million loss.
By December 2025, he had fully systematized the process into an automated algorithm called VIDA.
THE PROPRIETARY NVDA DIRECTION ALGORITHM
The same system he uses every trading day.
NVDA Direction brings the institutional edge to you. VIDA, our algorithm, gives you elite NVDA surveillance as it hunts the next explosive NVDA breakout. Combined with our proprietary Tradingview indicators and member dashboard, VIDA delivers the next NVDA breakout to you on a silver platter, daily. The playing field isn't just level anymore - it's tilted in your favor. For the first time in trading history, David has the power of Goliath. VIDA delivers actionable high probability signals for members every trading day. Members risk $1 to make $2. For brevity, we will assume a risk of $1500 to make $3000, but you can adapt these numbers to your risk profile (risk $200 to make $400, as long as the Risk:Reward is 1:2). Caution - Trading carries risks and all members must review and sign our disclaimer before using our service.

This isn't about trading "any" stock at "any" time. Our entire service is focused on one stock — NVDA — in one 90-minute window every trading day.
NVDA weekly options trade millions of contracts daily, with tight bid-ask spreads on near-the-money strikes.
Translation: With NVDA, the intended risk and reward aren't being unnecessarily consumed by wide option spreads.
NVDA can display institutional respect for cumulative order-book limit walls at key psychological levels.
When VIDA detects a significant order wall, the algorithm waits for confirmation before triggering a signal.
NVDA is influenced by the broader technology and semiconductor complex.
VIDA cross-references QQQ, SMH and NVDA in real time to add another layer of confirmation.
When VIDA detects a significant order wall, price may retest that level. The system then looks for confirmation from the underlying order flow before triggering a signal.
The objective is not to chase the first move. It is to wait for the confirmation that the setup is behaving as expected.
VIDA cross-references all three in real time. The goal is to avoid acting on an isolated signal when the broader sector picture isn't aligned.
Here's what most traders don't understand: the market changes after midday. VIDA stops trading after 11:30 AM because the conditions that create the morning opportunity begin to deteriorate.
London, Frankfurt and Euronext markets approach their close around this period, reducing the transatlantic institutional liquidity that contributes to the morning environment.
As institutional volume decreases, NVDA can transition from directional movement toward horizontal consolidation between opposing limit walls.
Holding short-dated options through midday consolidation can cause option premiums to decay while the underlying fails to provide the directional move needed for the trade.
Historical data used by the strategy indicates that 15-minute ADX can fall below the 25.0 trend threshold after the morning window, while momentum vectors flatten.
Based on the supplied backtesting framework, post-11:30 AM trades reduce session expectancy, with the morning strategy targeting an expectancy around +1.21R.
Trading after 11:30 AM is gambling. Stopping at 11:30 AM preserves capital and protects morning profits.
NVDA Directional Analysis - VIDA delivers a verdict (no trade / buy / sell) from 10 am to 11:30 am EST, Monday to Friday, through a members only web dashboard, accessible from any browser. If a buy / sell signal is triggered, VIDA will also provide specific execution parameters (which option to buy, limit price, profit target and stop loss). Members can also set up SMS alerts when critical momentum / volume thresholds are met.
NVDA Direction indicators for Tradingview - all members get access to the following indicators to monitor and identify NVDA breakouts, with specific guidelines on how to use these indicators:
📈 NVDA Direction Momentum
Provides buy / sell signals, with several entry parameters. Buy, Strong Buy, Sell, Strong Sell alerts are automatically displayed. For best results, always use 30 minute momentum for direction and 15 minute momentum for entries. More details available in the NVDA Direction Help Center.
📈 NVDA Direction Super DMI Strength
Provides strength of the current dominant force (buyers or sellers). For best results, use in conjunction with 30 minute momentum / 15 minute momentum and observe ADX since it signals “the hidden strength of the underlying dominant force (buyers / sellers)”. More details available in the NVDA Direction Help Center.
📈 NVDA Direction Daily Levels
Automatically display daily institutional levels on Tradingview including, but not limited to:
📈 NVDA Direction Price Display
Proprietary indicator to prominently display real time price at any location on your screen
Real Time Members Only SMS Alerts - Members can set up real time SMS Alerts when critical momentum / volume thresholds are met based on real time level 3 data.
You don't need to become an order flow expert.
You don't need to interpret complex momentum indicators.
You don't need a $50,000 Bloomberg terminal.
VIDA does all the heavy lifting.
Here's your actual workflow:
You open the members' area on your laptop or phone. That's it. No charts to set up. No indicators to configure. Wait for VIDA to trigger NVDA signals.
VIDA is constantly monitoring:
Between 10:00 AM and 11:30 AM, VIDA will constantly analyze NVDA and provide one of the following verdicts:
This means VIDA detected one or more disqualifying conditions:
When this happens, you do nothing. You protect your capital.
VIDA will issue a "STAND ASIDE" approximately 20% of trading days—and that's a feature, not a bug.
Because here's the truth: The best traders know when NOT to trade.
Overtrading destroys accounts. The algorithm prevents you from taking low-probability setups just because you're "itching to do something."
When ALL six conditions align simultaneously—trend power, momentum vector, structural level confirmation, sector confluence, and order flow liquidity buffer—VIDA will make a bullish (buy calls) or a bearish (buy puts) and members will get a trade alert with specific execution parameters for NVDA.
You receive an alert like this in the members' area, with specific parameters for you to replicate.
You open your broker platform (TD Ameritrade, Interactive Brokers, E*TRADE—any broker offering NVDA weekly options).
You place an OCO (One-Cancels-Other) bracket order :
If your broker doesn't support OCO orders, you manually set your stop and target after the entry fills.
Here's where discipline separates winners from losers:
You don't override the system.
You don't move your stop.
You don't exit early because you're nervous.
VIDA did all the heavy lifting, calculated your stop based on:
Your stop is placed behind institutional walls —not at arbitrary round numbers where retail stops get hunted.
Your target is calculated using the contract's Delta to convert the underlying stock's 1:2 risk-reward structure into exact option premium levels.
All you do is let probability play out.
If the first trade resolves (winner or loser), and there's still time before 11:30 AM, the system may issue a second signal if another valid setup appears before 11:30 AM.
Maximum two trades per day. No new trade alerts after 11:30 AM.
No overtrading. No revenge trading. No emotional decision-making.
After 11:30 AM, VIDA continues providing live market commentary and directional analysis on NVDA but without any trade alerts.
Why?
Because understanding how and why trades resolve helps you develop pattern recognition and deeper market structure knowledge.
You also get:
Let's talk about realistic expectations.
This is not a "get rich quick" system.
Internal testing with VIDA has shown:
Here's what that means in real terms:
If you execute 100 trades following the system exactly with a 1:2 RR with $1500:$3000 stop loss:profit target, the math works out as follows:
That's over a sample size where you're taking one to two trades per day, only when conditions align.
Note - Not every day produces a signal. Some weeks you'll take 7-9 trades. Other weeks you'll take 4-5.
But over time, positive expectancy compounds.
The transparent win/loss record is publicly available on our website and X feed. You can verify this yourself before committing a single dollar beyond the trial.
Before we go further, let's be crystal clear about what you're NOT getting:
You'll lose 40% of the time with NVDA Direction. That's built into the math. If you can't handle losing trades, this isn't for you.
This is about grinding out positive expectancy over dozens of trades. If you're looking for lottery tickets, this is not for you.
You need to log in by 10:00 AM, monitor for signals, and execute the orders. It's simple, but not effortless.
You need Level 2 options approval, understanding of calls/puts, and basic familiarity with OCO bracket orders. If you don't know what Delta means, you're not ready.
The system gives you the edge. You still need to follow the rules: no overriding stops, no revenge trading, no overleveraging. Break the rules, and no algorithm can save you.
Here's the philosophical shift that changes everything:
VIDA is not smarter than the market.
Neither is Dr. Chhoda. Neither is any retail trader.
But institutions—the ones moving $50 million, $100 million, $500 million at a time—leave footprints.
They can't hide when they're repositioning that much capital.
Those footprints show up as:
VIDA doesn't try to outsmart the market.
VIDA identifies when the whales are moving, confirms the direction with multiple technical filters, and rides on their backs.
You're not fighting Goliath.
You're letting Goliath do the heavy lifting while you tag along, compounding your profits.
Dr. Chhoda learned this lesson the hardest way possible: in the beginning, he didn’t survive long enough for positive expectancy to work.
When he lost $2 million, it wasn't because he didn't understand options. He's a certified software engineer who built custom algorithms. He had 10,000+ hours of screen time.
He blew up because he violated the cardinal rules of risk management:
Sound familiar?
Here's the brutal truth that nobody wants to hear:
Your edge doesn't matter if you're not around to execute it.
You can have the best entry signals in the world. But if you risk too much on a single trade, or take five trades in a row trying to "make back" a loss, or move your stop because "the trade just needs more room"...
You will blow up.
It's not a question of if. It's when.
Every single trade—win or lose—risks exactly $1,500.
Not $1,000 on "low conviction" setups and $3,000 on "high conviction" ones.
$1,500. Every time a signal is triggered and a trade is taken.
Why?
Because you can lose 10 trades in a row and still only be down 10%. Your account survives. You're still in the game.
Most traders blow up because they risk 5%, 10%, even 20% on a single trade. Three losers in a row and they're paralyzed.
Fixed risk keeps you alive.
Every trade targets exactly 2x the risk.
Not "let it run" with no plan.
Not "I'll take profit when it feels right."
Mechanical targets. Mechanical stops.
This creates positive expectancy even with a 60% win rate:
Over 100 trades, that's $120,000 in profit.
But only if you take EVERY stop and EVERY target exactly as specified.
The moment you start "managing" trades with discretion, you destroy the math.
After the second trade resolves (or after 11:30 AM), you're done.
No "just one more setup."
No "I'm on a roll, let me keep going."
No "I need to make back that loss."
Two trades maximum. Then walk away.
Why?
Because overtrading is the #1 killer of retail accounts.
The system protects you from yourself by enforcing a hard limit.
If you hit either of these thresholds, the system locks out all new trades for the rest of the day:
These aren't suggestions.
These are survival protocols.
Because here's what happens without them:
You hit two losers in the morning. You're frustrated. A third "setup" appears (probably not even valid, but your brain wants revenge). You take it. You lose. Now you're down -$4,500 and emotionally destroyed.
Or:
You hit three winners and you're up +$9,000. You feel invincible. You start taking marginal setups "because I can't lose today." You give back $6,000. You end the day at +$3,000 instead of +$9,000, hating yourself.
Circuit breakers prevent both scenarios.
The hardest lesson for active traders:
Doing nothing is often the highest-EV decision.
When the system says "STAND ASIDE," it's not because you're "missing an opportunity."
It's because there IS no opportunity.
Approximately 20% of trading days won't meet all six entry conditions. That's not a flaw.
That's what separates professionals from gamblers.
Amateurs take trades because they're bored. Because they "need to do something" even when conditions don’t align. Because they need action.
Professionals only trade when ALL edge factors align. They wait the rest of the time.
Stand Aside protects your capital for the days when real edge exists.
Here's the mindset shift that changes everything:
You are not trying to conquer the market. You are serving it.
The market doesn't care about your P&L. It doesn't care if you "need" a winner. It doesn't care if you're frustrated or confident or scared.
The market is always right.
Amateurs try to predict it. Amateurs try to outsmart it.
Professionals wait until conditions align, execute the trade, and accept the outcome.
When you respect the market—when you honor the forces that move billions of dollars daily—you stop fighting.
You stop trying to force trades that aren't there.
You stop moving your stop because "it can't go lower."
You stop exiting early because "I should take profit while I have it."
VIDA does all the work for you. You simply follow the VIDA verdict. You let probability work.
And here's the paradox:
The moment you stop trying to control the outcome, the moment you stop being discretionary, you start making money consistently.
Because you're no longer sabotaging yourself with emotional overrides.
You're simply executing a mechanical edge, trade after trade, over a large enough sample size that math takes over.
You might be wondering:
"If this system is so effective, why not just keep it private and trade your own account?"
Fair question.
Dr. Chhoda does trade this system every single day with his own capital. He recovered his entire $2 million loss using this exact framework.
So why make it available?
Because the game is rigged—and he's tired of watching retail traders get crushed.
Institutions have access to tools you don't:
You get TradingView charts, education on x about candlesticks from traders who’ve never made any money, delayed data, and hope.
It's David versus Goliath.
But what if David could see exactly where Goliath was doing?
What if you could identify the massive institutional order flow walls, confirm sector alignment with QQQ/SMH, wait for momentum to validate the direction, and enter the same setups the big money is taking?
That's what VIDA does.
It doesn't level the playing field.
It flips the script entirely.
You're no longer fighting institutions. You're riding on their backs.
And Dr. Chhoda built this because after losing everything—his IRA, his wife's IRA, years of accumulated wealth—he realized something:
Retail traders aren't losing because they lack the skills. They're losing because they don't have the right information.
Give them the tools, enforce the 1:2 risk reward discipline, and suddenly...
They start winning.
That's the mission behind NVDA Direction.
Here's exactly what you get when you start your $1 trial:
Every trading day, you'll receive one of two signals between 10:00 am and 11:30 am EST:
"STAND ASIDE / NO TRADE" (approximately 20% of days)
→ All six technical conditions did not align. No trade. Preserve capital.
"BUY [Contract] / SELL [Contract]" (approximately 80% of days)
→ Complete execution parameters:
Maximum 2 signals per day (A second trade is alerted if the first trade resolves before 11:30 AM and a second valid setup appears).
After the trading window closes:
This isn't just about "copy and paste" signals.
You're learning to think like an institutional trader.
Every week, you receive:
Full transparency. No cherry-picking. No hiding losses.
You see everything—just like Dr. Chhoda does with his own trading.
Inside the members' area:
On the website and X feed:
Every. Single. Trade. Signal.
Wins. Losses. Stand-asides.
No hiding. No marketing tricks. No "hypothetical" results.
You can verify the 60% win rate, 1:2 risk-reward, and positive expectancy before you commit beyond the $1 trial.
This system works with any broker offering NVDA weekly options:
If your broker doesn't support OCO orders, you can manually set your stop and target after entry fills - this requires more attention.
Some members prefer trading with firm capital instead of their own. We can recommend reputable prop firms that support option trading AND:
Reach out after joining and we'll point you in the right direction.
Using a proprietary process, we analyze NVDA direction and institutional participation in real time and help members enter trades during regular trading hours, Monday to Friday. All members follow strict rules for profit taking and stop loss with a 1:2 Risk Reward Ratio.
Trading is not an exercise in money making. It is an exercise in discipline. It’s not about making money to have a better lifestyle. It’s about being disciplined to have a better life.
That discipline involves accepting small losses and allowing positive expectancy to play out over a large number of trades. I kept failing until I fixed this myself.
- Nitin Chhoda PT, DPT
Nitin Chhoda PT, DPT is a Certified JavaScript Developer (CJSD), and has spent over 10,000 hours analyzing price action, momentum and volume on ES / QQQ / SMH / NVDA.
With extensive experience developing algorithms on AWS including CI/CD workflows and Microsoft Azure, Dr. Chhoda is also a Certified Node.js Developer (JSNSD).
As an experienced ES futures and NVDA options day trader, owner of multiple technology companies and an angel investor in several companies including Palantir and IONQ,
Dr. Chhoda decided to develop his own algorithm to determine intraday direction of NVDA, something he uses daily in his own day trading. Having seen retail traders get
crushed daily on NVDA because they were trading blind without order flow data, Dr. Chhoda refined his approach with his own capital, streamlined the entire process so any
disciplined trader could execute the same setups he takes daily, without needing a $50K Bloomberg terminal or 10 years of experience reading Level 3 data.
Dr. Chhoda is also a consultant on money management, finance, investing and business management. He is a trusted adviser to day traders all over the world, and his clients include
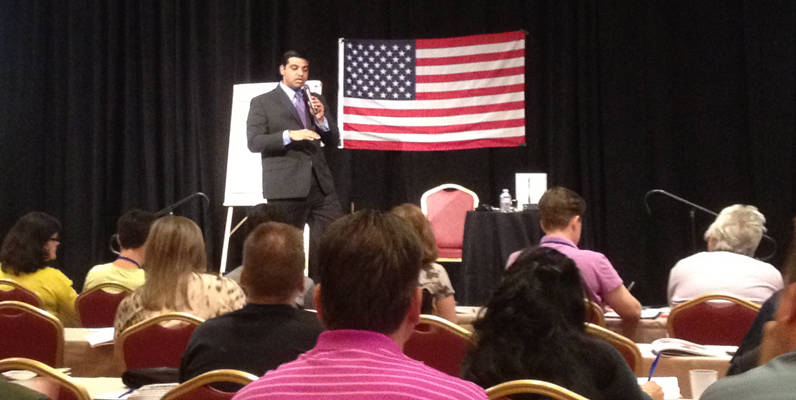
some of the biggest names in social media. He spends most of his time writing articles, speaking at conferences and consulting with clients on finance and business management.
He manages a team of engineers and professional coders who create custom software to analyze and determine underlying NVDA market patterns, and juggles multiple roles as a writer,
consultant, inventor and family guy.
follow us on X @NVDADirection.
Order flow confirmation (aggressive buyer / seller participation based on market orders)
Momentum confirmation (TSI vectors)
Trend strength confirmation (ADX)
Sector confirmation (QQQ/SMH alignment)
Structural level confirmation (VWAP/POC retests)
To keep VIDA’s decision-making fast and repeatable during the 10:00 AM – 11:30 AM EST window, VIDA analyzes these four essential quantitative criteria during that 90-minute window:
Regular Session VWAP Position & Slope: Price must be above a rising cash session VWAP for Calls, or below a falling VWAP for Puts. This RTH VWAP Alignment evaluates whether regular-session institutional buyers or sellers hold structural control.
15-Minute ADX Filter: ADX must be equal to or greater than 20 and sloping upward. Maximizes the probability that the market is actively expanding in trend strength rather than consolidating.
Multi-Timeframe Momentum Harmony: 15-minute and 30-minute momentum indicators must be pointing in the same direction. 15-minute and 30-minute momentum harmony helps members to skip entries during lagging or opposing signals.
Sector Confluence: QQQ and SMH moving in the same direction as NVDA relative to their respective session VWAPs. Validates broad tech and semiconductor market agreement to prevent algorithmic cross-hedging sweeps.
This 4-point criteria is non-negotiable, and serves as the definitive quantitative filter for VIDA’s daily 0DTE / 1 DTE NVDA execution window between 10 am and 11:30 am.
By requiring all four conditions to align simultaneously, VIDA systematically eliminates low-probability setups, false breakouts, and chop-induced option decay.
At NVDA Direction, VIDA uses 20.0 as a strict baseline filter for 15-minute 0DTE scalping, with the critical requirement that the ADX must be greater than or equal to 20.0 and sloping upward (rising). We prefer 20 instead of waiting for 25.
Waiting for an ADX reading of 25.0 on a 15-minute chart causes members to enter 0DTE option trades too late.
ADX at 20.0 & Rising (Scalper's Initiation Zone): Signals that price is actively transitioning out of range-bound chop into a new momentum expansion. Entering as ADX crosses above 20.0 positions your trade at the beginning of a 15-minute candle move, capturing the fastest delta expansion in 0DTE option premiums.
ADX at 25.0 (Trend Follower's Confirmation Zone): Confirms that a strong trend is already fully established. While ideal for equity trading or multi-hour swing positions, a 15-minute ADX hitting 25.0 on NVDA often occurs near the exhaustion of the initial 15-to-30 minute push. Entering at 25.0 increases the risk of buying option premiums at peak implied volatility right before a mean-reversion pullback.
| ADX Level | Market Condition | Execution Suitability for 0DTE Scalping |
|---|---|---|
| < 20.0 | Sideways chop / range-bound | STAND ASIDE: High risk of reversal and theta decay |
| 20.0 – 25.0 (Rising) | Emerging trend / breakout initiation | OPTIMAL: Maximum option delta expansion window |
| > 25.0 (Flat / Falling) | Mature or overextended trend | CAUTION: Scalp window may be ending; risk of pullback |
Absolute Value: ADX must be greater than or equal to 20.0
Vector Slope: ADX line must be sloping upward. A falling ADX reading of 22.0 indicates a weakening trend momentum, which is a "Stand Aside condition" regardless of the static ADX reading.
The NVDA Direction Momentum indicator provides the early warning sign of a potential price reversal, whereas NVDA Direction Super DMI Strength measures overall trend strength and acts as a lagging structural filter.
When the two indicators are out of sync, pay attention to each for its distinct operational purpose:
Momentum (Leading Indicator): Tracks price velocity and rate of change. Momentum decelerates, flattens, or flips directional vectors first—often several candles before a price reversal completes or before ADX reflects the shift.
ADX (Lagging Filter): Measures structural trend expansion regardless of direction. Because ADX relies on smoothed multi-period averages, an elevated ADX reading (e.g., above 40) will lag significantly and remain artificially high while a trend is actively exhausting or turning.
High/Elevated ADX + Momentum Flipping Counter-Trend:
What it Means: Trend exhaustion or an impending sharp mean-reversion counter-move.
Operational Rule: Do not enter new trend-continuation trades. Use the Momentum flip as an early signal to tighten stops or scale out of existing positions.
Falling ADX + Momentum Aligned With Trend:
What it Means: Low-volume trend drift or range-bound consolidation. Price may still be creeping in one direction, but the lack of institutional volume expansion makes options contracts vulnerable to rapid theta decay.
Operational Rule: Stand aside. Wait for the ADX vector to bottom and curl upward before entering.
ADX Below 20.0 + Momentum Whipsawing:
What it Means: Non-trending, chop regime.
Operational Rule: Stand aside completely to preserve capital.
Rely on Momentum as your early warning radar to prepare orders and manage open risk, but enforce ADX expansion (greater than or equal to 20 and sloping upward) as the mandatory confirmation trigger before entering new positions.
The 9:30 AM to 10:00 AM EST opening window is discarded to eliminate low-probability opening noise and allow VIDA to reveal when all quantitative criteria are structurally grounded.
Indicator Warm-Up & Vector Accuracy: Multi-timeframe indicators (15-minute and 30-minute momentum signals, ADX trend strength) require settled candle data to calculate true directional momentum. Trading before 10:00 AM exposes setups to false crossover signals (whipsaws) caused by volatile opening wicks. VWAP and ADX instability improves after the first 30 minutes because the 9:30 AM – 10:00 AM window contains two 15-minute candles, and the ADX has enough data to verify if trend strength is genuinely expanding above 20.0 or merely printing a temporary open-market spike.
Benchmark Level Establishment: The 9:30–10:00 AM window establishes the necessary intraday structural baselines—specifically the Initial Open High (IOH), Initial Open Low (IOL), and anchored intraday VWAP. Waiting until 10:00 AM allows the framework to trade confirmed retests of these established levels rather than chasing unvalidated opening drives. The Session VWAP requires roughly 30 minutes of regular trading hours volume to establish a reliable benchmark level and slope. Before 10:00 AM, the VWAP line is overly reactive to individual large blocks of volume. Opening Range Price Discovery occurs from 9:30 AM to 10:00 AM. This period serves as the market's initial price discovery phase, where institutional buyers and sellers battle for control. Waiting until 10:00 AM lets the market establish clear opening range boundaries, allowing you to trade with confirmed institutional momentum rather than guessing into early-session chop.
Order-Flow Stabilization: Market-on-Open (MOO) imbalances, overnight limit retail orders, and aggressive algorithmic sweeps dominate the tape during the first 30 minutes. By 10:00 AM, Cumulative Order Book (COB) limit walls stabilize into reliable institutional support and resistance floors. VIDA’s built-in non trade parameter (do not trade from 9:30 am to 10 am) protects members from Algorithmic Liquidity Sweeps and False Breakouts at the open. Institutional high-frequency algorithms execute heavy Market-On-Open (MOO) order flow during the opening 30 minutes. This produces violent "wick-heavy" price action—sharp 15-minute spikes up or down designed to sweep liquidity on both sides of the pre-market range—resulting in stop-outs right before the real direction takes hold.
Option Pricing & Spread Normalization: Option bid-ask spreads are artificially wide immediately at the opening bell due to market-maker uncertainty. VIDA protects members against Implied Volatility (IV) premium overpricing, Options premiums are artificially inflated at the 9:30 AM bell as market makers price in overnight risk and gap uncertainty. Within the first 15 to 30 minutes, this implied volatility rapidly contracts (IV crush), causing 0DTE option premiums to lose value rapidly even if NVDA moves slightly in your direction.Waiting until 10:00 AM allows option contract spreads to tighten, significantly reducing entry slippage.
Sector Confluence Verification: Major sector ETFs (QQQ and SMH) undergo heavy opening rebalancing during the first 30 minutes. The 10:00 AM operational start guarantees that broad-tech and semiconductor sector VWAP alignment can be accurately audited before members undertake directional risk.
One of VIDA’s core rules is that the 15-minute ADX should be equal to or greater than 20 and sloping upward.
At 9:45 AM, VIDA only has a single completed 15-minute bar. A single candle can create an artificial ADX spike due to opening bell volatility, but it cannot establish a trajectory.
At 10:00 AM, VIDA has two completed 15-minute bars (9:30–9:45 and 9:45–10:00), allowing VIDA to mathematically verify whether the ADX line is genuinely rising or already flattening out.
During the 9:30 AM – 9:45 AM window, Session VWAP is highly erratic because total regular-hours volume is still low. A single institutional block trade can wildly distort the VWAP line and flip its slope angle. By 10:00 AM, 30 minutes of high-volume cash trading establishes a true VWAP baseline and a reliable institutional slope vector.
While the sharpest IV drop occurs in the first 5 minutes, 0DTE option premiums experience continuous volatility compression across the entire 9:30 AM – 10:00 AM opening range. Entering at 9:45 AM frequently results in buying option contracts whose implied volatility is still deflating, causing contract values to drag even if NVDA price ticks in your favor during the second 15-minute bar.
No—it means the system IS working. It's protecting your capital.
Let’s walk through a typical zero-trade morning:
You log into VIDA. NVDA is already moving $0.75 in the first few minutes.
Your old self would've thought: "It's moving! I should get in!"
VIDA Dashboard shows:
ADX: 21.5 (below 25 threshold) ❌
15m TSI: Bullish, but 30m TSI: Flat ❌
Status: "STAND ASIDE - Insufficient trend strength"
You watch the price move. You feel the pull. But VIDA says no.
So you don't trade.
NVDA retests VWAP. Looks like it might bounce. Five out of six conditions align.
Your old self would've thought: "Close enough. Five out of six is pretty good."
VIDA Dashboard shows:
Order Flow: ✅ (Bid wall at $146.80)
Momentum: ✅ (Both timeframes aligned)
Trend: ✅ (ADX now 26)
Structure: ✅ (VWAP retest)
Time Window: ✅ (10:00-11:30 AM)
Sector: ❌ QQQ above VWAP but SMH below
Status: "STAND ASIDE - Sector divergence. QQQ and SMH not aligned."
You stare at it. It looks good. But VIDA's rule is non-negotiable: ALL six conditions or nothing.
You leave it alone.
Still no change. Conditions still haven't aligned.
VIDA Status: "STAND ASIDE - No valid setup detected today."
You close your laptop.
You don't check it again. You don't wonder "what if." You don't feel like you missed something.
Because VIDA already told you: If the setup isn't undeniable, you're not trading.
Your account: $0 profit. $0 loss.
Your capital: 100% preserved.
Your discipline: Intact.
And that's a WIN.
On days like this, most traders:
Force a trade out of boredom → Lose $1,500
Enter on "pretty good" setups → Get stopped out → Lose $1,500
Take three marginal trades trying to "find something" → Lose $4,500
You? You lost $0.
Over 100 trading days:
40 zero-trade days = You preserve $60,000+ in capital that would've been lost on bad setups
60 valid signal days = You execute high-probability trades with proper edge
Zero-trade days aren't failures. They're survival.
VIDA doesn't just tell you when to trade. It tells you when NOT to trade—and that's equally valuable.
Some mornings, closing your laptop at 10:15 AM is the most profitable decision you can make.
Since our members like to take positions after 11:30 am, we can provide general guidelines for members who want to take discretionary trades using our analysis; however VIDA will not provide alerts after 11:30 am.
Outside the standard 10:00 AM – 11:30 AM EST execution window, market volume naturally contracts, increasing the risk of theta decay and false breakouts. To override time-based restrictions, all six quantitative criteria for either direction must trigger simultaneously on a completed 15-minute candle.
15-Minute ADX Re-Expansion: ADX must remain greater than or equal to 20, stop declining, and print an upward-sloping vector to confirm fresh momentum expansion.
DMI Directional Crossover (+DI Dominance): The 15-minute +DI line must cross above the -DI line, confirming net buyer dominance over seller volume.
RTH Session VWAP Reclamation: NVDA must achieve a 15-minute candle close above the RTH Session VWAP line, with the VWAP trajectory flattening or angling upward.
Multi-Timeframe Momentum Harmony: Both the 15-minute and 30-minute Momentum lines must be actively pointing upward without conflicting signals.
Order Flow Liquidity Clearance: Overhead resting sell walls must be absorbed or canceled, with a rising bid floor stacking beneath current price in order flow depth.
Sector Confluence: QQQ and SMH must both trade above their respective RTH Session VWAPs, exhibiting positive 15-minute momentum.
15-Minute ADX Re-Expansion: ADX must remain greater than or equal to 20, stop declining, and print an upward-sloping vector (confirming trend acceleration to the downside).
DMI Directional Crossover (-DI Dominance): The 15-minute -DI line must cross above the +DI line, confirming net seller dominance over buyer volume.
RTH Session VWAP Breakdown: NVDA must achieve a 15-minute candle close below the RTH Session VWAP line, with the VWAP trajectory flattening or angling downward.
Multi-Timeframe Momentum Harmony: Both the 15-minute and 30-minute Momentum lines must be actively pointing downard without conflicting signals.
Order Flow Liquidity Clearance: Underlying resting buy floors must be breached or swept, capped by a descending ask ceiling in order flow depth.
Sector Confluence: QQQ and SMH must both trade below their respective RTH Session VWAPs, exhibiting negative 15-minute momentum.
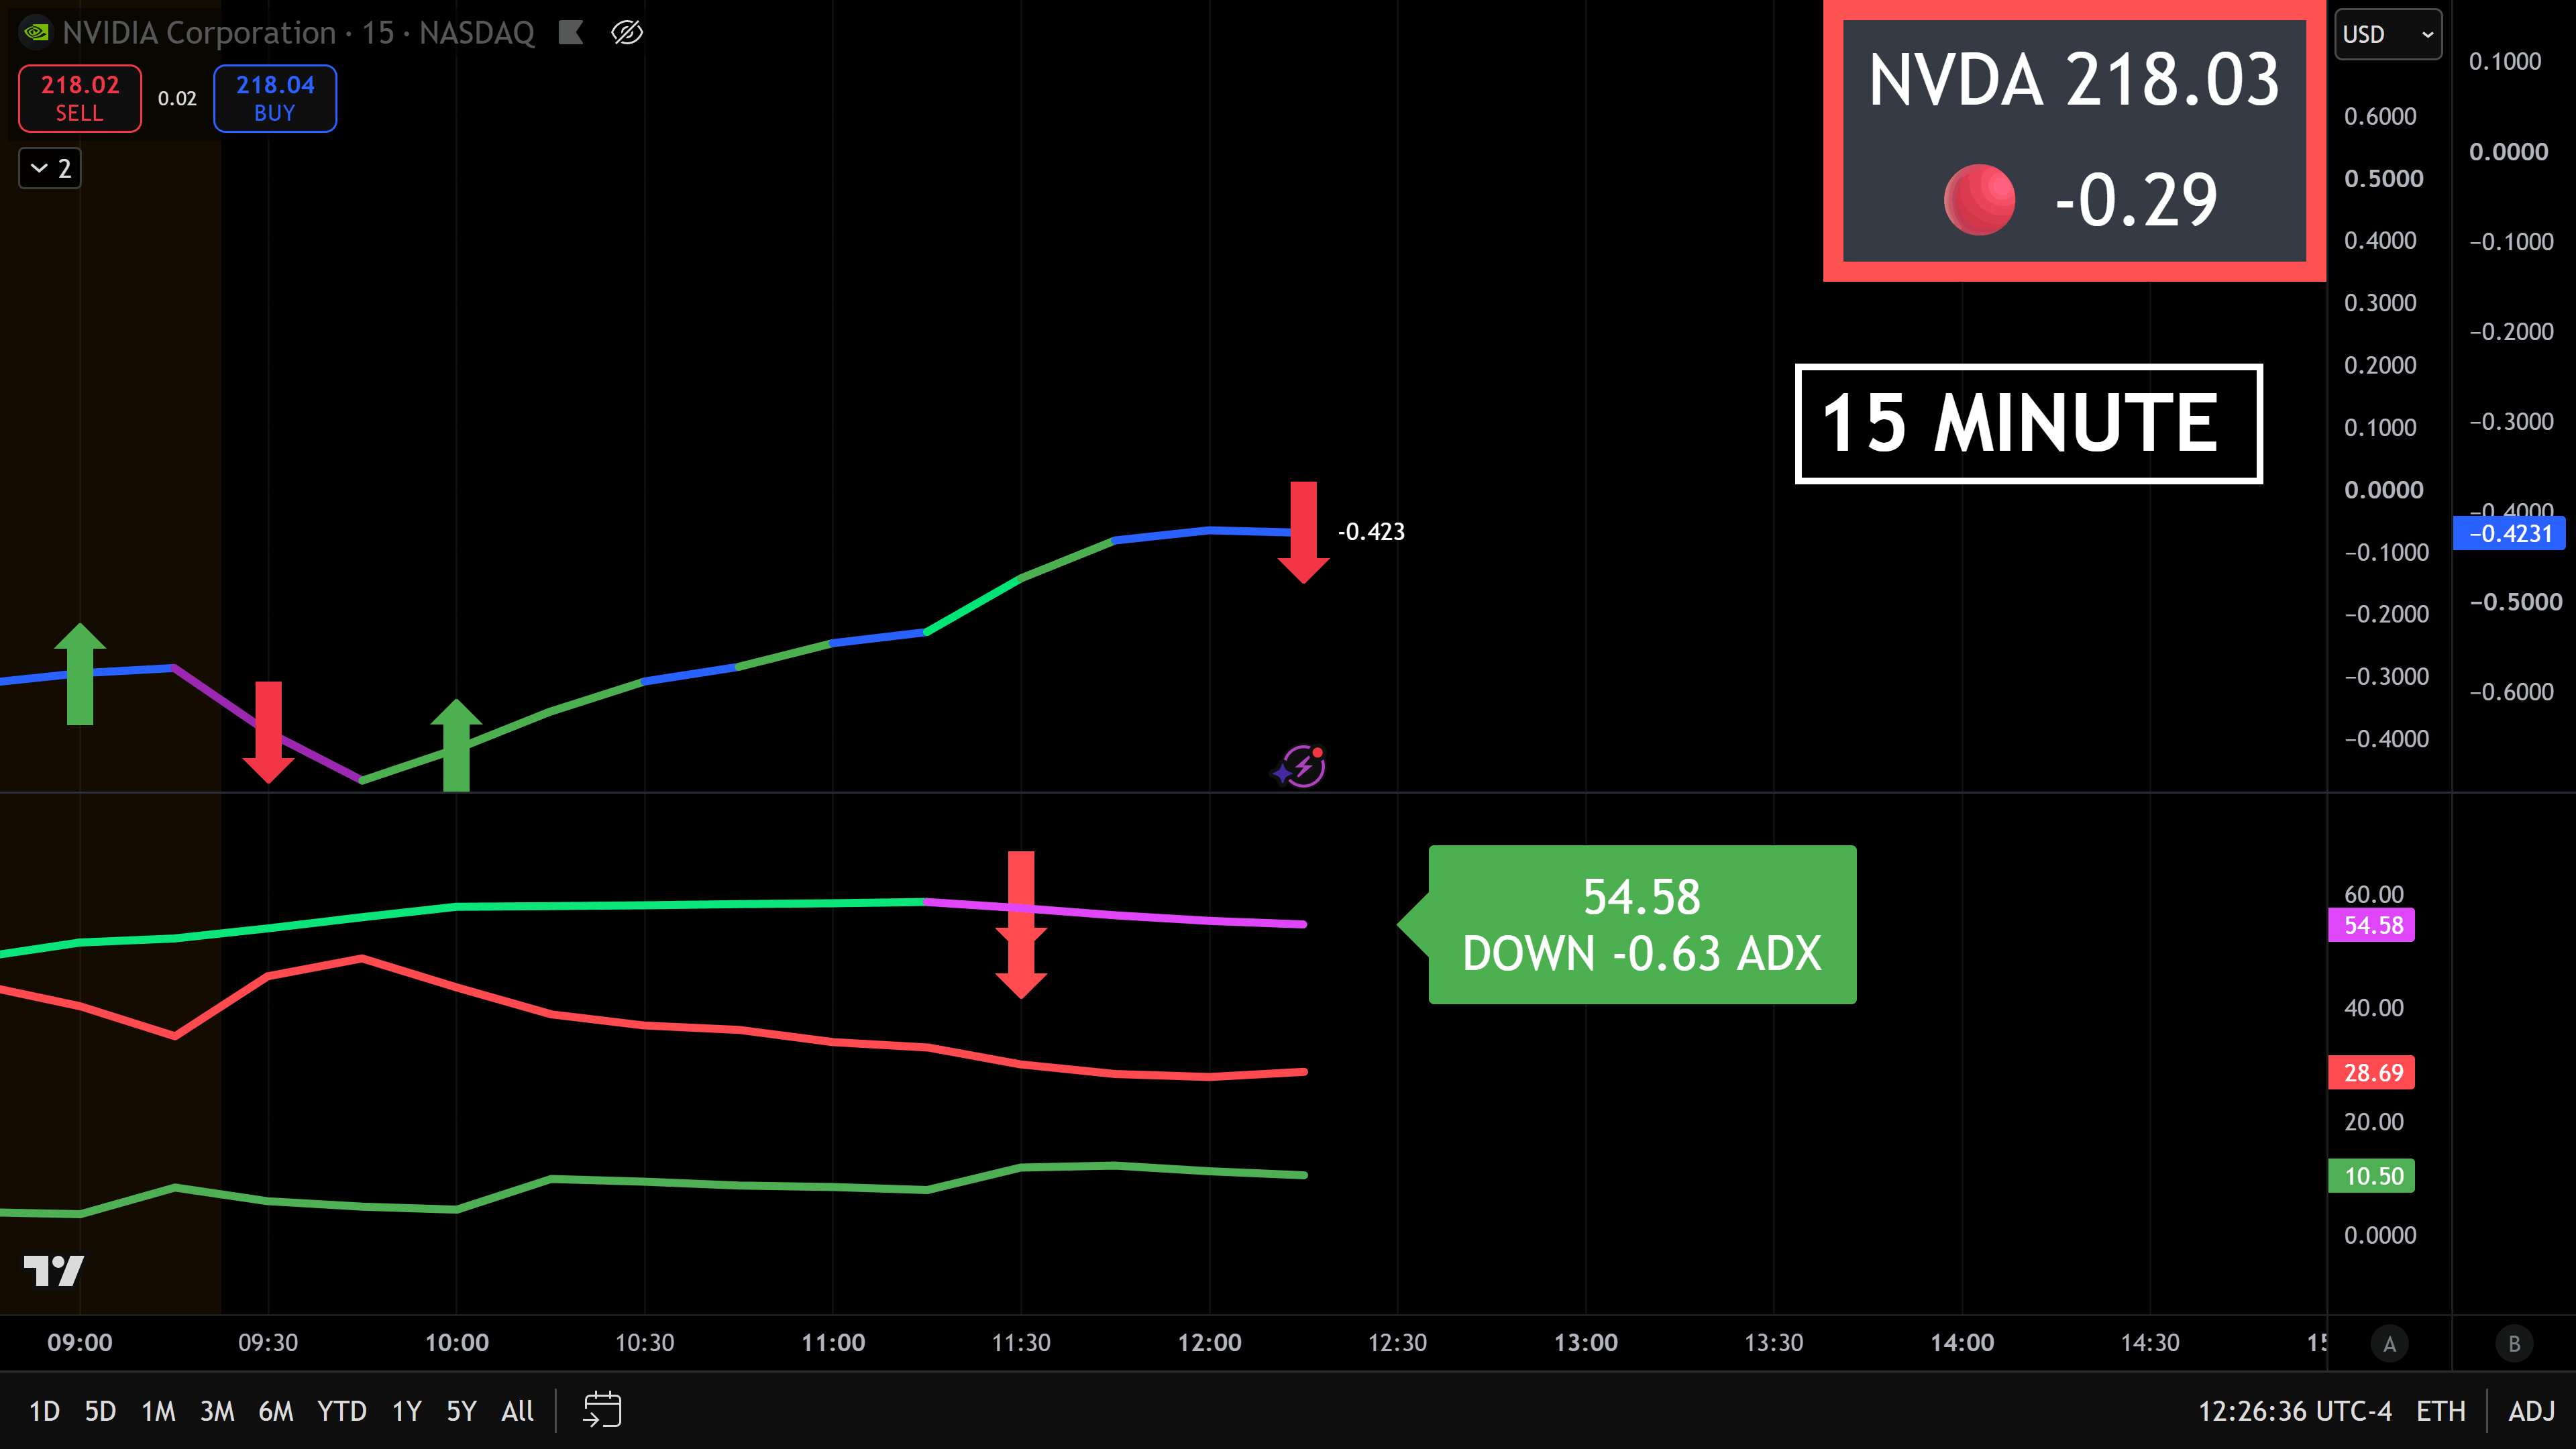
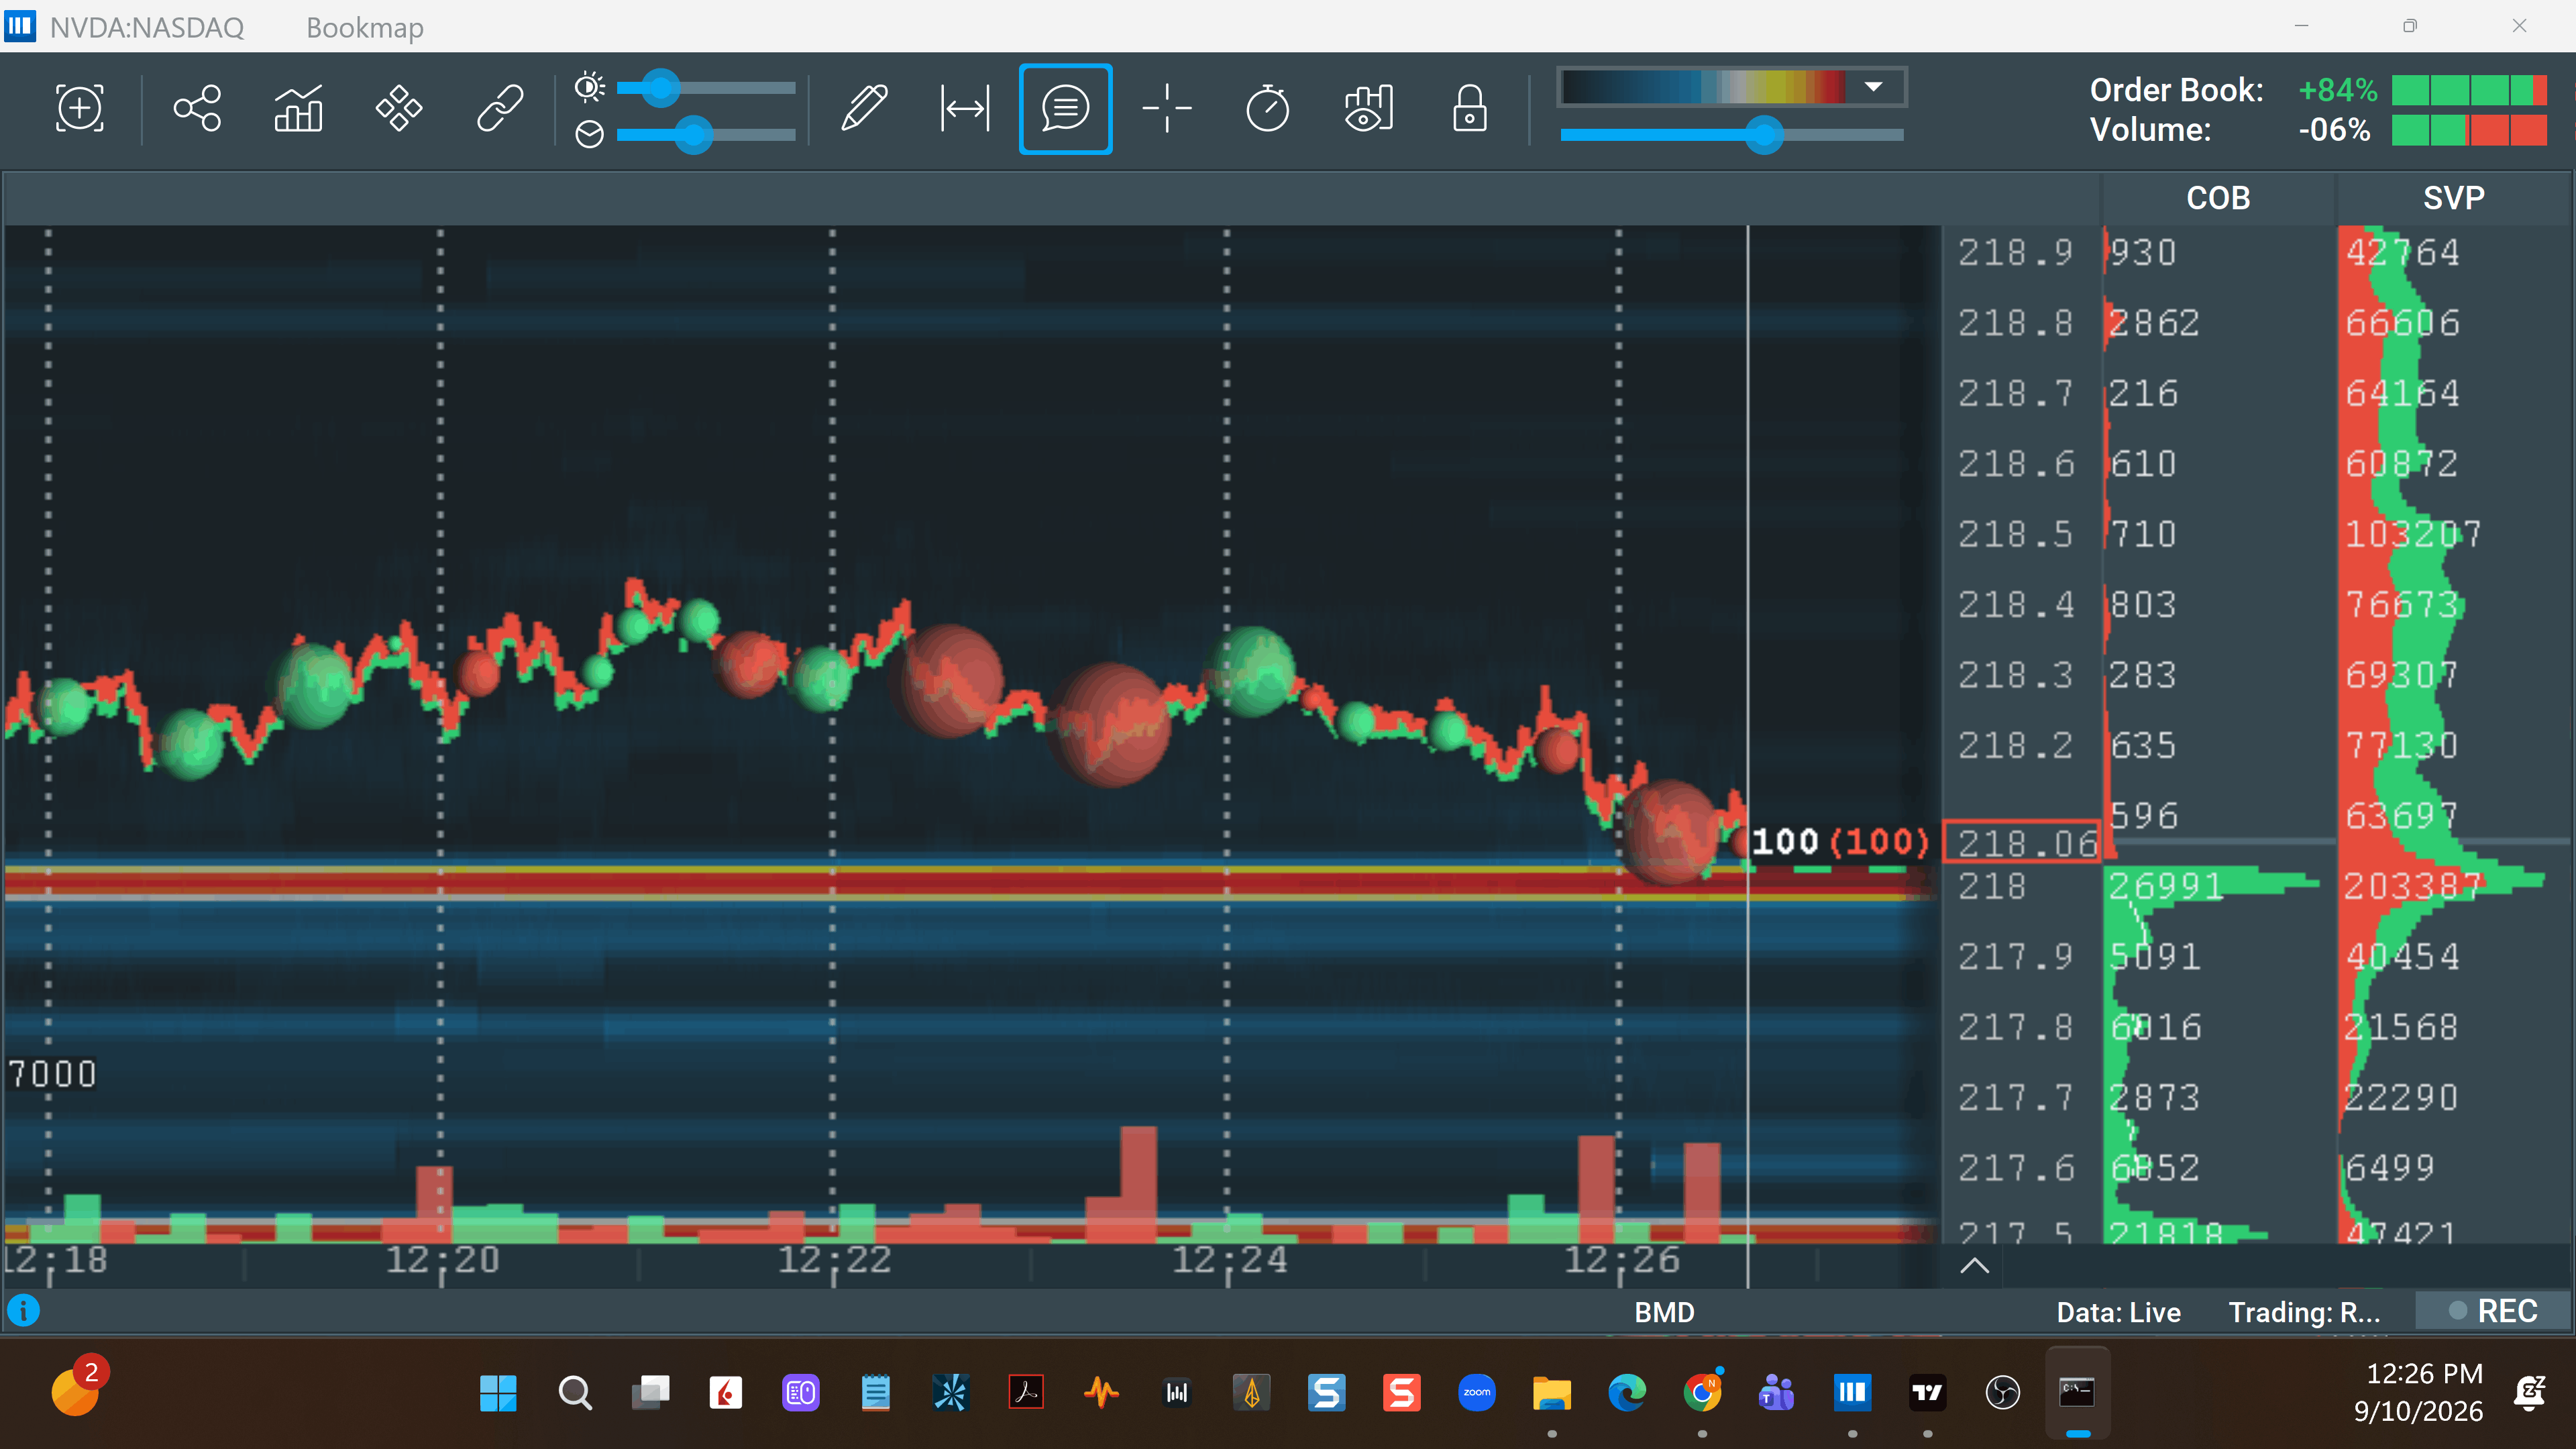
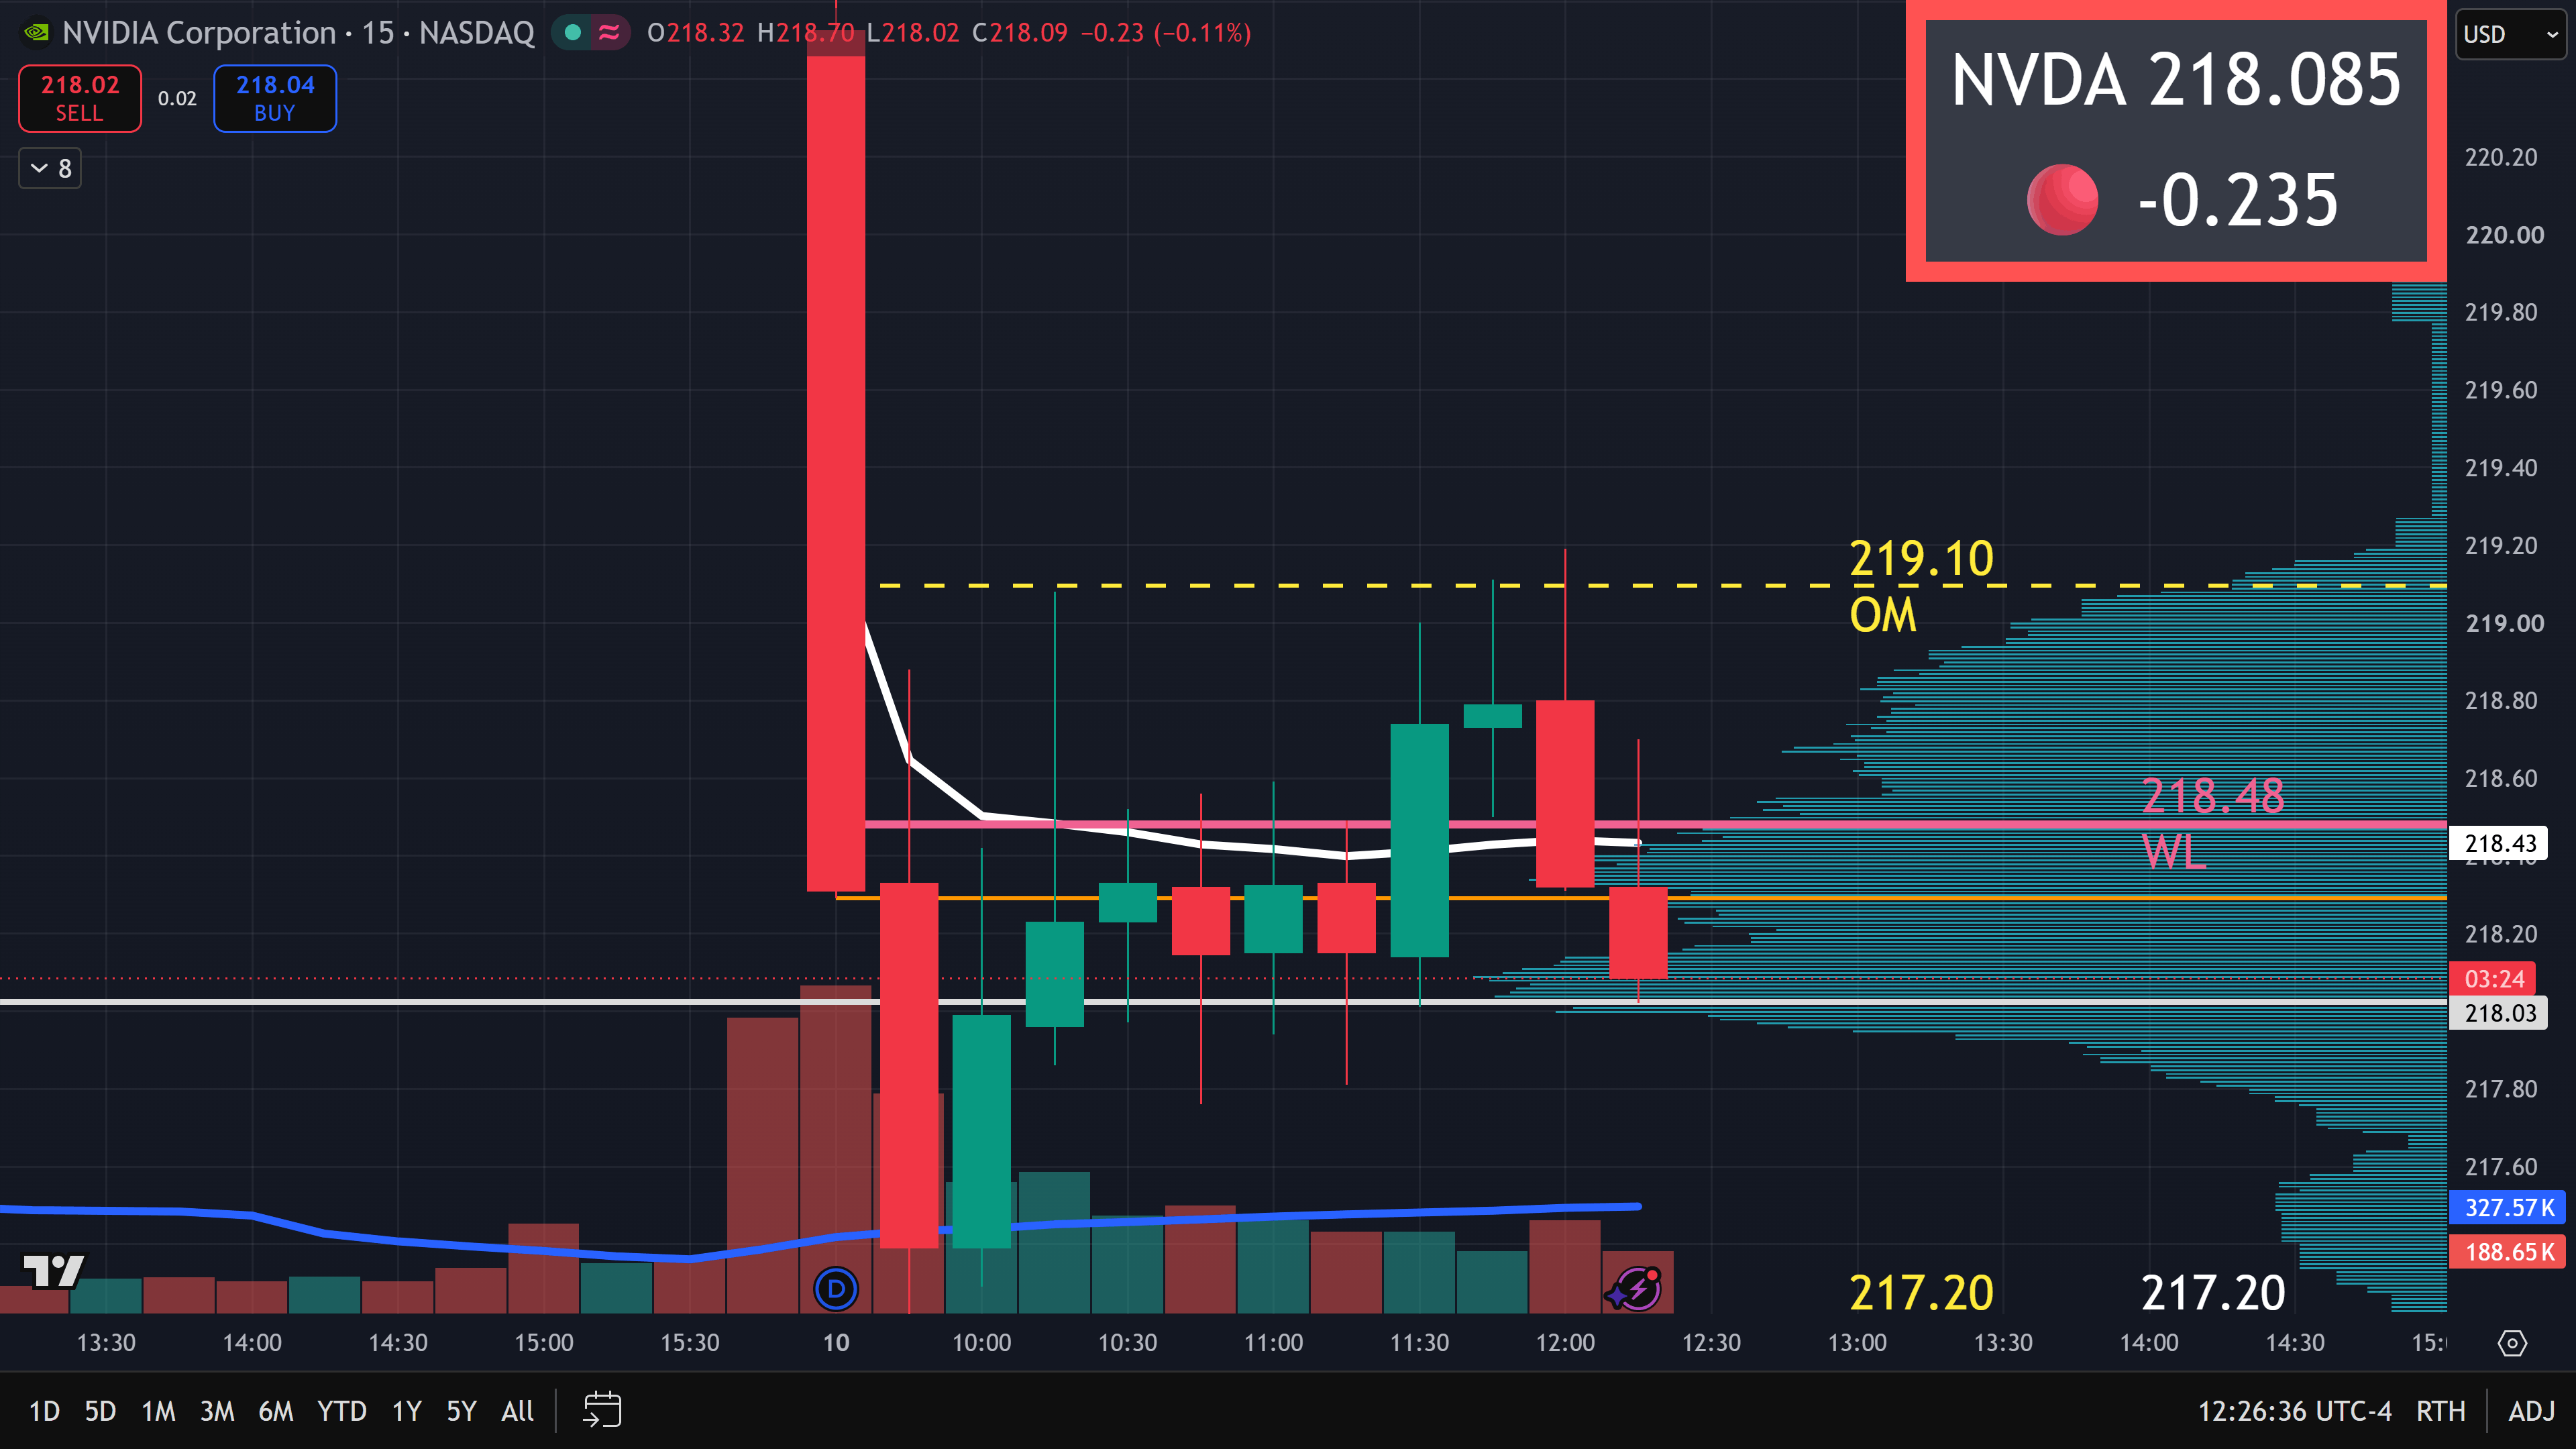
Here are the items analyzed by VIDA on September 10, 2026 at 12:30 pm.
The move higher (prior to the loss of the VWAP) was a textbook intraday fake out—a counter-trend mean-reversion bounce into overhead Session VWAP resistance that immediately rejected and resumed the primary downward move.
VWAP Resistance Rejection: Price attempted to test the RTH Session VWAP ($218.48), briefly reaching $218.50 before running out of buying volume. Failing to hold above VWAP triggered aggressive institutional selling, driving the price back down toward $218.00.
Order Flow Supply Wall: Heavy resting sell limit orders between $218.50 and $219.00 absorbed the temporary buying push without yielding, establishing a firm supply ceiling.
Sector Rollover: Both QQQ and SMH rolled over in tandem, dropping toward and below their respective intraday session VWAPs ($709.74 and $561.89) to realign with broader market selling.
The execution rules performed as designed by filtering out this false rally:
Persistent -DI Dominance: Even while price ticked upward, the 15-minute -DI reading (28.69) maintained complete dominance over +DI (10.50). This proved that the upward tick was merely short-covering rather than aggressive institutional buying.
Declining ADX Vector: The 15-minute ADX line (54.58) continued its downward slope (-0.63 ADX), confirming that overall trend expansion was stalling rather than launching a new bullish phase.
Momentum Realignment: The 15-minute Momentum indicator flipped back down (-0.423) with a downward arrow, realigning directly with the bearish 30-minute Momentum vector (-0.494).
NVIDIA is heavily targeted by institutional high-frequency algorithms and options market makers, making these types of fake outs standard behavior throughout the trading day.
Algorithmic Liquidity Sweeps: Because NVDA attracts massive retail 0DTE options volume, algorithms frequently push price toward prominent levels (such as Session VWAP or previous 15-minute highs) to sweep liquidity. This triggers buy-stops and entices retail traders into calls directly into institutional sell orders.
High Respect for Quantitative Filters: Over large sample sizes, NVDA respects VWAP position, DMI alignment, and ADX vectors with high consistency. Counter-trend rallies in NVDA almost universally fail when -DI remains dominant and Session VWAP fails to curve upward.
0DTE Option Protection: Buying a false breakout on 0DTE options leads to rapid premium destruction from immediate delta loss and high theta decay. Requiring +DI to cross above -DI alongside a rising ADX vector systematically eliminates the vast majority of these trap moves on NVDA.
6 out of 10 trades hit the profit target = +$18,000
4 out of 10 trades hit the stop loss = -$6,000
Net profit over 10 trades: +$12,000
Average expectancy: +$1,200 per trade
Valid setups occur on approximately 80% of trading days (roughly 4 out of 5 days per week)
When conditions align, you receive 1-2 signals maximum between 10:00 AM - 11:30 AM EST
Total: approximately 25-30 trade signals per month
6-9 winners at +$3,000 each = +$18,000 to $27,000
4-6 losers at -$1,500 each = -$6,000 to $9,000
Net profit: +$12,000 to $18,000/month
| Month | Signals | Win-Loss | Gross P/L | Subscription Cost | Net P/L |
|---|---|---|---|---|---|
| 1 | 12 | 7-5 | +$13,500 | -$299 | +$13,201 |
| 2 | 14 | 8-6 | +$15,000 | -$299 | +$14,701 |
| 3 | 11 | 6-5 | +$10,500 | -$299 | +$10,201 |
| Total | 37 | 21-16 | +$39,000 | -$897 | +$38,103 |
$150K+ account to execute $1,500 risk per trade (1% risk management) to earn $3000 per trade.
Level 2 options approval
Discipline to follow every signal without cherry-picking or overriding
✅ Basic options mechanics (calls vs. puts, how they gain/lose value)
✅ How to read an options chain and identify the correct contract
✅ What Delta means (roughly how much your option moves per $1 stock move)
✅ Time decay (theta) and why options lose value daily
✅ How to place entry, stop loss, and profit target orders in your broker platform
✅ Level 2 options approval from your broker (ability to buy calls/puts)
✅ $150K+ trading capital to execute $1,500 risk per trade at 1% risk management (this is a recommendation, you can start with a lower amount. Example - $10K+ trading capital to execute $100 risk per trade at 1% risk management or start with options trading prop firms - reach out to us after you sign up for recommendations)
✅ 6-12 months minimum of options trading experience (even if inconsistent)
❌ Advanced strategies (spreads, iron condors, etc.)
❌ How to read complex order flow tools like Bookmap or interpret technical indicators (the system handles this)
❌ Greeks beyond Delta (we calculate the rest)
"BUY Dec 10 $240 Call / Entry: $3.20 / Stop: $2.15 / Target: $5.35 / Size: 14 contracts"
Can I place an options order right now without Googling "how to buy a call"?
Do I understand why I'll lose 40% of trades and that's normal with positive expectancy?
Can I execute a $1,500 risk trade without it representing more than 2% of my account?
✅ Order flow confirmation (institutional 20,000+ share walls positioned)
✅ Multi-timeframe momentum alignment (15m + 30m TSI vectors both bullish/bearish)
✅ Trend strength validation (ADX > 25, actively trending not chopping)
✅ Structural level retest (VWAP/POC/IOH holding as support/resistance)
✅ Sector confluence (QQQ AND SMH both above/below VWAP—no divergence)
✅ Institutional rebalancing window (10:00-11:30 AM EST only)
No entry price (market order? what price?)
No stop loss (or vague "trail it" guidance)
No profit target (or "let it run" hope)
No position sizing (how many contracts?)
| Parameter | Example Execution Metric |
|---|---|
| Contract | Dec 10 $230 Put |
| Entry Limit | $3.20 |
| Stop Loss | $2.15 (placed behind institutional walls, not arbitrary levels) |
| Profit Target | $5.35 (strict 1:2 risk-reward) |
| Position Size | 14 contracts |
| Max Risk | $1,500 (exactly 1% of $150K account) |
| Target Profit | $3,000 |
Cherry-picked winning screenshots
"Hypothetical" backtests with perfect hindsight entries
Vague claims of "profitable for years" with no verification
Run by marketers who've never actually traded
✅ Real-time 21-day win/loss record published on website and Twitter (updated daily)
✅ Every signal shown: Wins, losses, stand-asides—nothing hidden
✅ Verifiable 60% win rate with 1:2 risk-reward producing +1.21R expectancy
✅ Created by Dr. Chhoda who LOST $2M of his own money (2021-2023), then rebuilt the entire loss using this exact system after 10,000+ hours of refinement
✅ Traded daily with real capital —not theoretical, not backtested, not marketed by someone who doesn't trade
Price hits your stop loss (e.g., $2.15)
Your position closes automatically
You lose exactly $1,500 (the predetermined risk)
You do nothing—no revenge trading, no "making it back," no emotional reaction
You wait for the next signal and execute it EXACTLY as specified
✅ Lose $1,500 without emotional reaction (this number can be adjusted downwards based on your risk tolerance but the Risk Reward ratio must always be 1:2)
It's a business expense, not a personal failure.
✅ Lose 3-4 trades in a row without panic
With 60% win rate, occasional losing streaks are statistically normal.
✅ Take EVERY stop loss exactly as specified
No "giving it more room." No "it's close to working." The moment you override stops, you destroy the risk-reward structure.
✅ Trust the process over 50-100 trades
Individual trades mean nothing. Sample size is everything.
✅ Execute EVERY signal without cherry-picking
Skipping signals you "don't like" destroys expectancy just as surely as moving stops.
❌ Moving stops: "I'll give it more room..." → Your $1,500 loss becomes $2,500, killing the math
❌ Taking early profits: "Better to lock in $1,200 than risk it..." → Your $3,000 winners become $1,200 winners, destroying the 1:2 ratio
❌ Revenge trading: "I lost, now I'll double size to make it back..." → One bad trade becomes a catastrophic loss
❌ Cherry-picking signals: "I'll skip this one, it doesn't look good..." → You skip winners and take losers, inverting your edge
❌ Quitting after losses: "Three losers in a row? This doesn't work!" → You quit right before the winning streak
60 winners = +$180,000
40 losers = -$60,000
Net = +$120,000
Take every stop at exactly $1,500
Take every target at exactly $3,000
Execute every signal without emotion or override
• Maximum holding time: 90 minutes (10:00 AM - 11:30 AM EST window)
• Typical resolution: Most trades hit either the profit target or stop loss within 45-75 minutes
• Hard cutoff: We don’t issue trade alerts after 11:30 AM EST. This is when European markets close and institutional liquidity drops dramatically. NVDA also transitions from directional momentum to range-bound chop. Holding past this point subjects you to theta decay without edge.
• Target profit: Exactly $3,000 per trade
• Risk-reward ratio: Strict 1:2 (you risk $1,500 to make $3,000)
• Target calculation: The system uses Delta translation to convert the underlying stock's structural target into precise option premium levels
• Example: If signal fires at $3.20 entry, your target might be $5.35 (depending on the contract's Delta)
• Maximum loss: Exactly $1,500 per trade
• Risk management: Fixed 1% of $150K account
• Stop placement: Calculated based on structural levels (VWAP, order flow walls, key pivots)—NOT arbitrary percentages
• Stop logic: Your stop is placed *behind* institutional order flow walls where 20,000+ share limit orders are defending levels
| Execution Parameter | Values Provided to Members |
|---|---|
| Contract | Dec 10 $230 Call |
| Entry Limit | $3.20 |
| Stop Loss | $2.15 |
| Profit Target | $5.35 |
| Position Size | 14 contracts |
| Max Risk | $1,500 |
| Target Profit | $3,000 |
| Max Duration | 90 minutes |
• Price moves in your favor
• Target at $5.35 hits within 45-75 minutes
• Position closes automatically (if using OCO orders)
• Profit: +$3,000
• Price moves against you
• Stop at $2.15 hits
• Position closes automatically
• Loss: -$1,500
• If neither target nor stop hits by 11:30 AM, you evaluate the position
• Typically close manually to avoid post-11:30 AM chop and theta decay
• Outcome depends on where price is relative to your entry
✅ Never move your stop — It's placed behind institutional walls for a reason. Moving it destroys the risk-reward structure.
✅ Never take profits early — If you exit at +$1,500 instead of waiting for +$3,000, you destroy the 1:2 ratio that creates positive expectancy.
✅ Generally, do not hold past 11:30 AM hoping for recovery — Edge disappears when European markets close. Cut it and move on.
• Not $1,000 on "safer" setups
• Not $3,000 on "high conviction" plays
• Exactly $1,500. Every time.
• You can lose 10 trades in a row and only be down 10% ($15,000 on a $150K account)
• Removes emotional position sizing ("how much should I risk this time?")
• Creates consistent expectancy math over large sample sizes
• You stay alive long enough for positive expectancy to work
| NVDA Direction Uses: | NVDA Direction Does Not Use: |
|---|---|
| ✅ Fixed stops at institutional levels | ❌ Trailing stops |
| ✅ Placed behind real-time order walls (20,000+ share bids/asks) | ❌ Percentage-based stops |
| ✅ Below/above VWAP or key pivots | ❌ ATR-based stops |
| ✅ At points where trade thesis is invalidated | ❌ "Feel-based" stop adjustments |
| Approach | 6 Winners | 4 Losers | Net Profit |
|---|---|---|---|
| Fixed targets ($3,000) | +$18,000 | -$6,000 | +$12,000 |
| Trailing stops (avg $1,500) | +$9,000 | -$6,000 | +$3,000 |
| Trailing stops (avg $1,000) | +$6,000 | -$6,000 | $0 |
• "I'm locking in profit!"
• "I'm being smart!"
• "I'm afraid this winner will reverse, so I'll exit early"
Target hits $5.35 → You make exactly $3,000 → Winner ✅
Stop hits $2.15 → You lose exactly $1,500 → Loser ❌
• Below a major order flow bid wall (institutions defending that level)
• Below VWAP on long setups (institutional support)
• Below the 15-minute swing low
• Hit two full losses (-$1,500 × 2) → STOP TRADING
• Prevents revenge trading spirals
• Forces you to come back tomorrow with a clear head
• Hit two full winners (+$3,000 × 2) → STOP TRADING
• Bank the profit
• Prevents giving it back through overtrading
• Even if both resolve in 30 minutes, you're done after the second trade
• No exceptions
• Lose $1,500 → Get frustrated → Overtrade → Lose $3,000 more → Revenge trade → Account destroyed
• ADX ≤ 25 (not trending)
• QQQ and SMH on opposite sides of VWAP (sector divergence)
• No clean order flow walls (liquidity too thin)
• TSI momentum flat or divergent
• European markets close → Institutional liquidity drops
• NVDA transitions from directional trends to range-bound chop
• Theta decay accelerates without directional movement
• ADX typically drops below 25 (losing trend strength)
• Statistical expectancy drops toward zero
• Fixed $1,500 risk per trade
• Fixed stops at structural levels (NO trailing)
• Fixed $3,000 targets
• Position sizing calculated automatically
• Maximum -$3,000 loss per day (2 full losers → stop)
• Maximum +$6,000 profit per day (2 full winners → stop)
• Maximum 2 trades per day regardless of outcome
• Only trade 10:00 AM - 11:30 AM EST
• Stand aside ~20% of days when conditions don't align
• Approximately 10-15 trades per month total
• Take EVERY stop at exactly $1,500 (no overriding)
• Take EVERY target at exactly $3,000 (no early exits)
• Execute EVERY signal (no cherry-picking)
• NO adjustments, NO trailing, NO discretion
• 10 consecutive losses × $1,500 = -$15,000 (10% drawdown)
• You're still alive. You can continue trading.
• 10 consecutive losses × 5% = -40% drawdown
• Psychologically destroyed
• Account crippled
• Game over
✅ $1,500 risk per trade (fixed position sizing)
✅ Stops placed at structural institutional levels (NOT trailing)
✅ $3,000 targets (strict 1:2 risk-reward maintained)
✅ OCO bracket orders (set it and forget it)
✅ Maximum 2 trades per day with daily circuit breakers
✅ Stand aside when conditions don't align (~40% of days)
✅ Hard stop at 11:30 AM EST (no holding into midday chop)
This service is explicitly designed for intermediate to advanced options traders with significant capital and market experience.
This is NOT for beginners.
You've been trading options for 2-5+ years. You understand the mechanics (Delta, theta, how premiums move). You have a $150K+ account. You've had great months (+$15K-$20K) and terrible months (-$10K-$15K).
Your problem: You know HOW to trade, but struggle with WHEN to enter, emotional exits, and revenge trading after losses.
What you need: A systematic framework that removes emotional decision-making, confirms institutional positioning, and enforces discipline.
You'll succeed with this system if: You can follow mechanical signals without overriding them, even when it "feels wrong."
You have $200K+ in trading capital. You've traded options for 1-3 years with mixed results. You understand the basics but lack institutional-grade tools. You watch NVDA make massive daily moves but can't figure out optimal entry timing.
Your problem: You're "guessing" on entries without order flow confirmation. You feel like you're fighting institutions instead of following them.
What you need: Access to the same order flow data institutions use, multi-layer confirmation systems, and exact execution parameters.
You'll succeed with this system if: You have capital to execute $1,500 risk trades comfortably and discipline to follow mechanical signals.
You've blown up an account (or multiple accounts) through emotional trading. You've lost $50K, $100K, even $500K+ by overtrading, moving stops, and revenge trading. You've finally learned that discipline beats conviction.
Your problem: You need protection from yourself—hard stops, circuit breakers, trade limits that prevent emotional spirals.
What you need: A system with mechanical rules you CAN'T override, daily loss limits, and proven methodology from someone who's been where you are (Dr. Chhoda lost $2M before creating this).
You'll succeed with this system if: You've learned from past mistakes and are ready to follow rules without exception—no matter what your emotions tell you.
You MUST already have:
Experience:
Capital:
Broker Access:
Availability:
Psychology:
Answer honestly:
Do you have:
If you answered "no" to more than 2 questions, you're not ready yet.
Get more experience. Build your capital. Develop discipline. Then come back when you're qualified.
Traders who can profit over the long term with NVDA Direction have the following attributes:
These traders make $10K-$20K+ monthly or more, because they execute with discipline.
Traders who fail:
These traders blame the system when the real problem is they weren't qualified to begin with.
This is a professional-grade execution system for intermediate to advanced traders with:
If you're a beginner, you're not ready. Get foundational education, paper trade for 6 months, build your capital—then come back when you're qualified.
If you're qualified, the $1 trial will prove it immediately.
Execute 10-15 trades following exact parameters. If you're stressed, confused, or wanting to "improve" the signals—you weren't ready.
If you execute mechanically and see edge materialize over sample size—welcome to institutional-grade trading.
We're not trying to be elitist—we're trying to prevent you from losing money because you lacked prerequisite knowledge before executing live $1,500 risk trades.
No, you cannot.
None of our members should expect unrealistic financial outcomes. We do not promise quick monetary gains with minimal effort.
Trading, like any other professional endeavor, requires time, skill, and hard work.
According to the United States Securities and Exchange Commission, day trading is a complicated and risky form of investing, particularly when using margin, options, or other leveraged products.
Please review our disclaimer before you invest in NVDA Direction. NVDA Direction cannot and does not make any guarantees about your ability to get results or earn any money with our ideas, information, tools, or strategies.
All services provided by NVDA Direction are for educational and informational purposes only.
Certain examples may be provided to facilitate the educational process, but they are solely for educational purposes and are not to be construed as financial advice. They are not representative of consistent returns or an expectation of future gains.
The system works with any broker offering NVDA weekly options and Level 2 options approval. We don't require or endorse a specific broker.
Why we recommend it:
Best for: Experienced traders with $150K+ accounts who want professional execution and lowest costs
Trade-off: Steeper learning curve—interface less intuitive than retail platforms
Commission impact: \~$42/month on 12 trades with 14 contracts each (vs. $218/month at TD Ameritrade)
Why we recommend it:
Best for: Active traders who want powerful tools and are willing to pay slightly higher commissions for premium platform
Trade-off: $0.65/contract commissions (but execution quality often saves more in slippage)
Why we recommend it:
Best for: Options-focused traders who want simplified, predictable pricing
Trade-off: Platform designed primarily for options sellers, but works perfectly fine for buyers
Charles Schwab:
E*TRADE:
Best for: Traders who want reliability without platform complexity
Webull:
Robinhood:
If you're currently on Robinhood/Webull and have been getting reliable execution, you can use them—just be prepared to manually manage stops and targets. Professional execution requires a professional platform like IBKR or Charles Schwab.
What is an OCO order?
One order with three components that execute automatically:
When entry fills, stop and target are placed automatically. When one executes, the other cancels.
This is "set and forget" execution—no watching ticks, no emotional decisions.
Brokers with full OCO support:
Brokers WITHOUT OCO (subject to change):
If your broker doesn't support OCO: You can manually set stop and target immediately after entry fills—just requires 30-60 seconds of additional attention per trade.
With 10-15 trades per month at 14 contracts per trade:
| Broker | Price / Contract | Monthly Cost (12 trades x 14 contracts) | Annual Cost |
|---|---|---|---|
| Interactive Brokers | $0.25 | $42 | $504 |
| Tastytrade | $0 open / $10 close | $120 | $1,440 |
| TD/Schwab/E*TRADE | $0.65 | $218 | $2,616 |
| Webull/Robinhood | $0 | $0 | $0 |
Important consideration:
Better execution quality can save $0.05-$0.10 per contract in slippage. On 14-contract trades, that's $70-$140 per trade.
Over 12 trades: Slippage savings = $840-$1,680
Conclusion: The annual commission difference between IBKR ($504) and TD ($2,616) is $2,112—but superior execution often saves more than that in reduced slippage.
For $1,500 risk trades, execution quality > commission savings.
Some members prefer trading with prop firm capital instead of their own money.
How prop firms work:
Benefits:
Drawbacks:
Interested? Contact us after joining and we can recommend reputable firms that allow NVDA options trading and are compatible with this system's risk parameters.
The system works with any broker offering NVDA weekly options and Level 2 approval.
Our recommendations:
What matters most:
If your current broker checks these boxes, you're fine. If not—especially if you're on Robinhood—consider upgrading to a professional platform as your account grows.
Professional trading deserves professional tools.
This method was developed by Dr. Nitin Chhoda, an angel investor who has been trading NVDA options since 2019.
Using several proprietary indicators, personal experience, and the integration of various data points and AI tools, Dr. Chhoda developed an algorithm to determine directional bias and “ride along” with institutions.
The results are documented on our Twitter/X feed, @NVDAdirection
| Date | Total Signals | Winning Signals | Losing Signals | Success Rate |
|---|---|---|---|---|
| 10-07-26 | 1 | 1 | 0 | 100.00% |
| 10-06-26 | 1 | 1 | 0 | 100.00% |
| 10-02-26 | 1 | 1 | 0 | 100.00% |
| 10-01-26 | 1 | 1 | 0 | 100.00% |
| 09-30-26 | 1 | 1 | 0 | 100.00% |
| 09-29-26 | 1 | 1 | 0 | 100.00% |
| 09-28-26 | 1 | 1 | 0 | 100.00% |
| 09-25-26 | 1 | 1 | 0 | 100.00% |
| 09-24-26 | 1 | 1 | 0 | 100.00% |
| 09-23-26 | 2 | 2 | 0 | 100.00% |
| 09-22-26 | 3 | 3 | 0 | 100.00% |
| 09-21-26 | 2 | 2 | 0 | 100.00% |
| 09-18-26 | 1 | 1 | 0 | 100.00% |
| 09-17-26 | 0 | 0 | 0 | - |
| 09-16-26 | 1 | 1 | 0 | 100.00% |
| 09-15-26 | 0 | 0 | 0 | - |
| 09-14-26 | 0 | 0 | 0 | - |
| 09-11-26 | 0 | 0 | 0 | - |
| 09-10-26 | 1 | 1 | 0 | 100.00% |
| 09-09-26 | 0 | 0 | 0 | - |
| 09-08-26 | 1 | 1 | 0 | 100.00% |
| TOTAL | 20 | 20 | 0 | 100.00% |
Here's the deal:
Now that you’ve reviewed all the information, study the transparent track record on the website. Also review the testimonials from our members.
But none of that matters until you see it work in real time.
So here's what Dr. Chhoda decided:
Not a "watered down" trial version.
Not "limited features."
Full access. Everything.
For 30 days.
For a single dollar.
If you decide this system isn't for you—maybe the win rate isn't what you expected, maybe the discipline required is too much, maybe you just don't vibe with the approach—cancel anytime.
You won't be billed another cent.
No hoops to jump through. No "call customer service to cancel" nonsense.
One click. Done.
But if you see what Dr. Chhoda saw—if you watch the algorithm identify institutional footprints, wait for all six conditions to align, and fire signals that respect risk while targeting 1:2 returns—you'll want to stay.
Cancel anytime. No charges going forward. No annual commitment. No contracts.
Month-to-month. Simple.
At $299/month, you need one winning trade every 10 days to break even.
Just one.
If you only take 2-3 signals per week (approximately 10-12 per month), and you hit the 60% win rate over time...
That's if you execute with a $150K account risking 1% ($1,500) per trade.
If you scale up to a $300K account (risking $3,000 per trade with 1:2 targets of $6,000):
Same 60% win rate = \~$24,000 - $26,000/month net profit after the subscription fee.
Don't take Dr. Chhoda's word for it.
Don't take this letter's word for it.
Don't even take the testimonials' word for it.
Watch the algorithm in action for 30 days.
Track the signals. Paper trade them if you want to test without risk. Execute them live if you're ready.
Then decide.
Before you click the button, let's be absolutely clear:
✓ You're an experienced or intermediate options trader (not a beginner)
✓ You have a $100K+ account and Level 2 options approval
✓ You understand calls, puts, and basic risk management
✓ You're tired of emotional trading and inconsistent results
✓ You can log in by 10:00 AM EST most trading days
✓ You're willing to follow mechanical signals without overriding them
✓ You can handle losing 40% of trades while trusting positive expectancy
✓ You want to trade NVDA with institutional-level order flow confirmation
✓ You're a complete beginner who doesn't understand options
✓ You need to "understand why" before executing every trade
✓ You can't follow rules and want to trade "by feel"
✓ You're looking for 90%+ win rates or "never lose" promises
✓ You can't handle drawdowns or losing streaks
✓ You want to trade all day or need constant action
✓ You think $299/month is "too expensive" (if one winning trade covers 10 months of fees, it's not expensive—it's the best ROI you'll find)
You're at a decision point.
Wake up tomorrow. Watch NVDA make another massive intraday move. Watch for yourself how NVDA moves $7.50 in the first 2 hours of market open. Try to time your entry. Second-guess yourself. Enter late. Watch it reverse. Take a loss. Feel frustrated. Repeat.
Keep trading without institutional order flow data. Keep guessing where support and resistance actually matter. Keep sizing positions based on "conviction" instead of fixed risk. Keep overtrading. Keep giving back profits.
Six months from now, you'll be exactly where you are today.
Or worse.
Because here's the thing about inconsistent trading:
It compounds in the wrong direction.
One bad week leads to revenge trading. Revenge trading leads to overleveraging. Overleveraging leads to catastrophic losses. Catastrophic losses lead to starting over.
Dr. Chhoda lived this. $2 million gone.
You don't have to.
Tomorrow morning, you log into the members' area at 9:55 AM.
You wait.
At 10:14 AM, a signal fires:
"BUY Dec 10 $230 Call / Entry: $2.85 / Stop: $1.90 / Target: $4.75 / Size: 15 contracts / Risk: $1,500 / Target Profit: $3,000"
You copy the parameters into your broker. You submit the OCO order.
You walk away.
At 11:03 AM, your target hits. +$3,000.
You're done for the day.
No stress. No screen-watching. No second-guessing.
Just execution. Just math. Just results.
Six months from now, you've executed 60-80 trades. You've hit a 62% win rate. Your account is up $35,000-$45,000.
Not because you got "better at trading."
Because you stopped fighting the market and started following the footprints from NVDA Direction.
That's it.
30 days. $1. Full access.
See if the algorithm identifies setups you would've missed.
See if the risk management keeps you alive through losing streaks.
See if the 1:2 targets actually hit when you give trades room to work.
See if the STAND ASIDE signals save you from bad trading days.
Then decide if it's worth $299/month.
NVDA is making these moves right now.
Every single trading day between 10:00 AM and 11:30 AM EST, institutional money is repositioning. Order flow walls are appearing. Sector alignment is confirming direction.
The opportunities are there.
The question is: Are you going to keep guessing, or are you going to follow the footprints?
Dr. Chhoda spent 10,000+ hours, lost $2 million, and rebuilt from scratch to figure this out.
You don't have to.
You can shortcut the entire process for $1.
30 days from now, you'll either be:
The choice is yours.
The market is always right.
The whales leave footprints.
Follow them.
Dr. Nitin Chhoda, Founder of VIDA
10-19-26 03:05:20 PM
P.S. — Remember: You can cancel anytime during the 30-day trial with zero additional charges. No risk. No commitment. Just $1 to see if this is the edge you've been missing.
P.P.S. — The transparent win/loss record is live on the website right now. You can verify every signal, every outcome, every stand-aside before you join. No smoke and mirrors. No cherry-picked results. Just data.
P.P.P.S. — If you're still on the fence, ask yourself this: What's the cost of another six months of inconsistent results? Another $5,000 in losses from emotional overtrading? Another $10,000 from missed NVDA moves you watched but didn't execute? $1 to find out if there's a better way seems like the easiest decision you'll make all year.